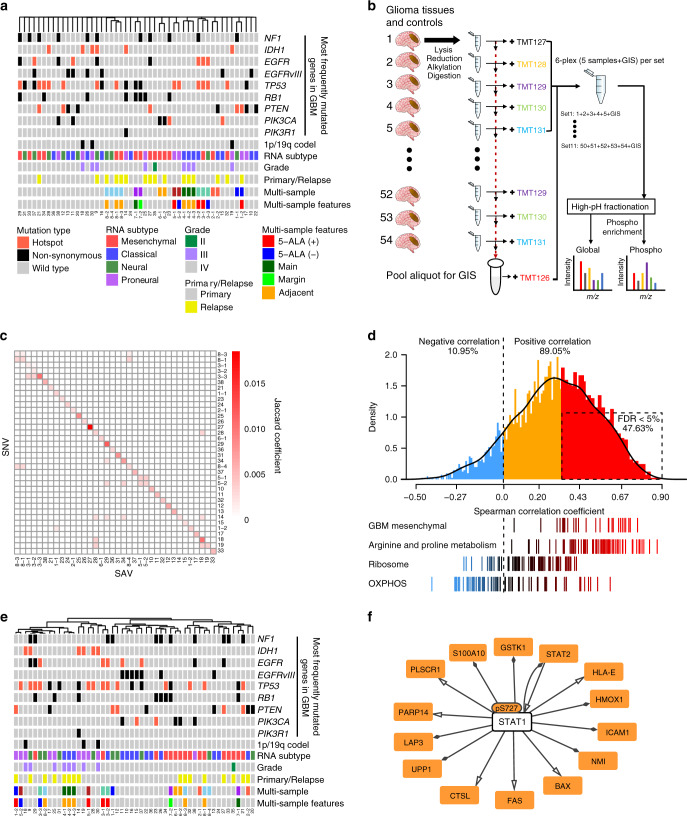
Fig. 1. Proteomic characterization reveals inter- and intra-patient molecular heterogeneity of glioblastoma multiforme (GBM).
a Characteristics of IDH wild-type GBM (N = 39), IDH mutant GBM (N = 2) and low-grade glioma (N = 9) tissue samples. Unsupervised hierarchical clustering with complete linkage was used to cluster samples based on the 1 – Jaccard coefficient as the distance metric. The type of mutations in the 8 most frequently mutated GBM genes5 are color-coded according to the legend. The multi-sample row displays multiple tumor samples obtained from the same patient as the same color; no color indicates unique samples. 5-ALA (within multi-sample features) indicates the intensity of the 5-aminolevulinic acid-induced fluorescence. b Overview of the multiplexed quantitative proteomic assay of glioma tissues. Trypsin-digested glioma (N = 50) and control normal tissues (N = 4) were tagged with a six-plex tandem mass tag (TMT): TMT127-131 for samples and TMT126 for the global internal standard (GIS) control. A total of 11 sets for 54 samples were prepared. High-pH fractionated peptides were subjected to liquid chromatography-tandem mass spectrometry to identify and quantify phosphopeptides and global proteins. See “Methods” for further details. c Coherence map of single-nucleotide variants (SNV) and single amino acid variants (SAVs). d Correlations between mRNA and protein levels in glioma tissue samples. (Top) Density plot of Spearman’s correlation coefficients between mRNA and protein abundance using the 8034 proteins detected in all GIS samples (N = 4071 at the gene level). Statistically significant positive correlations with a false discovery rate (FDR) <5% are indicated by the dashed-line box. (Bottom) Distribution of correlation coefficients for gene sets of interest. e Unsupervised hierarchical clustering of the 50 samples with global-proteomic data. Complete linkage and the distance metric 1 – Pearson’s correlation coefficient was used for clustering. f Genetic regulatory network activated in IDH wild-type tumors. The transcription factor–target gene regulatory network was formed by the significantly upregulated phosphoproteins and global proteins in IDH wild-type tumors using the OmniPath database61 in Cytoscape. Source data are provided as a Source Data file.

