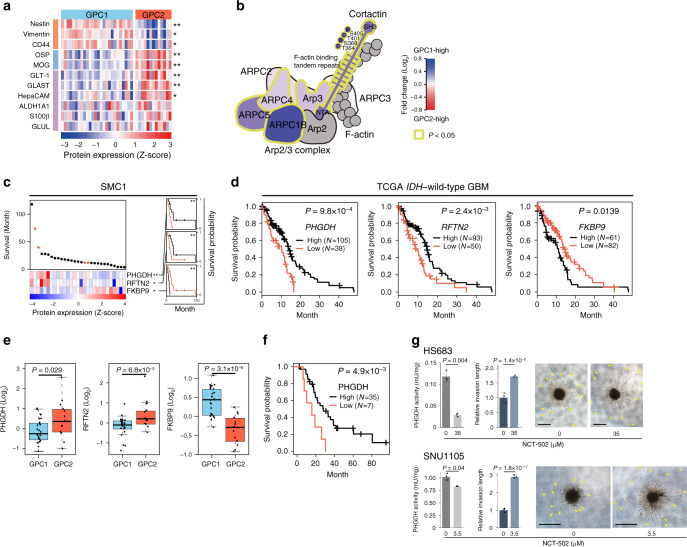
Fig. 4. GPC2-associated PHGDH predicts a favorable prognosis in IDH wild-type GBM.
a Differential expression of protein markers for NSCs (orange), oligodendrocytes (blue), and astrocytes (purple) between proteomic subtypes. *P < 0.05, **P < 0.001; two-sided unpaired Student’s t-test. See Supplementary Data 3 for exact P-values. b The cortactin-Arp2/3 complex is elevated in GPC1 tumors. The gray color indicates proteins with no available protein expression data. P-values were calculated by two-sided unpaired Student’s t-test. c Prognostic biomarker proteins in IDH wild-type GBM. Deceased and surviving patients are denoted by black and red dots, respectively. *P < 0.05, **P < 0.01; univariate Cox regression test. Kaplan–Meier (KM) survival curves for IDH wild-type GBM patients (N = 29) in the SMC1 cohort were shown on the right for each of the three proteins (black: high expression, red: low expression). **P < 0.01; two-sided log-rank test. d Kaplan–Meier (KM) survival curves. Patients were classified by the optimal gene expression thresholds reported by Uhlen et al.28. P-values were calculated using the two-sided log-rank test. e Box-jitter plots for the abundance of the indicated proteins. The description of the box-and-whisker plots is the same as in Fig. 3b. Statistical significance of the downregulation of favorable markers (PHGDH and RFTN2) and upregulation of an unfavorable marker (FKBP9) was evaluated by Student’s t-test (one-sided unpaired). The number of samples for GPC1 and GPC2 is 26 and 13, respectively. f KM survival curves for PHGDH-high vs. low patients in the SMC-TMA cohort. Patients were classified as described in d. P-values were calculated as in d. g PHGDH activity (left), relative invasion lengths (middle), and representative images of 3D invasion (right) of the indicated tumor spheres after treatment of vehicle (DMSO) or NCT-502 for 48 h at the indicated concentrations. Two-sided unpaired Student’s t-test was used to compare PHGDH activity. Two-way ANOVA was used for the comparison of relative invasion length between treatment groups. Error bars indicate ±SD, N = 3. Arrowheads indicate invasive fronts. Scale bar: 500 μm. Source data are provided as a Source Data file.

