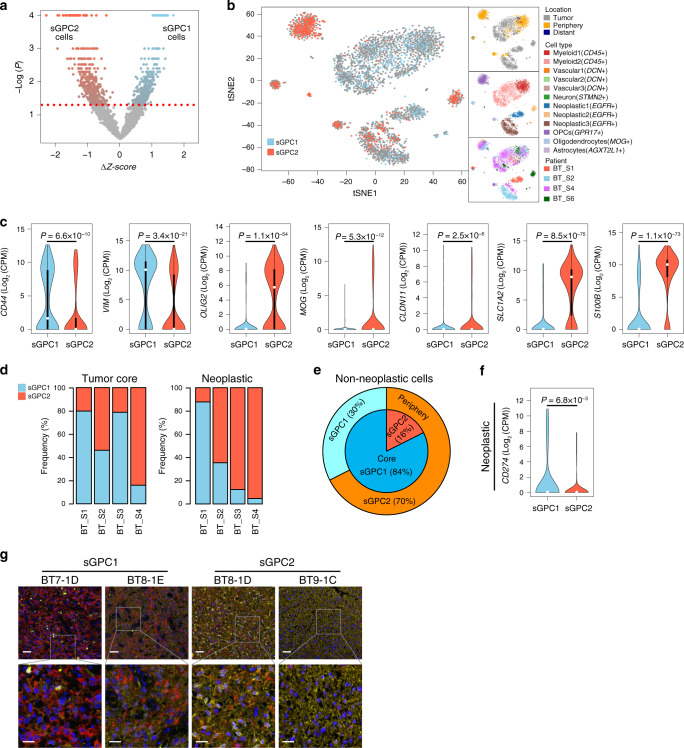
Fig. 5. Classification of GBM single cells reveals tumor-layer-dependent and cell-type-dependent characteristics of GPC-subtypes.
a Classification of GBM single cells from the data set reported in Darmanis et al. 31. The red dotted line indicates the statistical threshold used to determine the surrogate GPC (sGPC) subtype of single cells. b 2D t-SNE projection of single cells of surrogate-proteomic subtypes. t-SNE coordinates, single-cell annotations describing the location within the 3D tumor mass, cell type, and the patient origin (shown in right side panels) were obtained from Darmanis et al.31. c Subtype-specific mRNA expression of neural stem cell (NSC), oligodendrocyte, and astrocyte markers in single cells. CD44/VIM, OLIG2/MOG/CLDN11, and SLC1A2/S100B represent NSC, oligodendrocyte, and astrocyte markers, respectively. The violin plots represent density distributions. The description of box and whisker plots in violin is the same as in Fig. 3b. P-values were obtained by two-sided unpaired Wilcoxon rank-sum test. d Proportion of tumor core single cells (left) and neoplastic single cells (right) of two subtypes in four specimens in the data set generated by Darmanis et al. 31. e Proportion of non-neoplastic single cells of two subtypes in the Darmanis et al. 31 data set. f Subtype-specific mRNA expression of an immune checkpoint ligand CD274 (PD-L1) in neoplastic single cells. The description of the violin plot is the same as in c. P-values were obtained by two-sided unpaired Wilcoxon rank-sum test. g Representative images (N = 1) of multiplex fluorescent immunohistochemistry analysis of SMC-TMA samples using PHGDH (yellow) and Nestin (red) antibodies. Nuclei were stained with DAPI (blue). Sample IDs and their respective sGPC-subtypes are indicated above the image. Scale bars: 50 μm (upper panels), 20 μm (lower panels). Source data are provided as a Source Data file.

