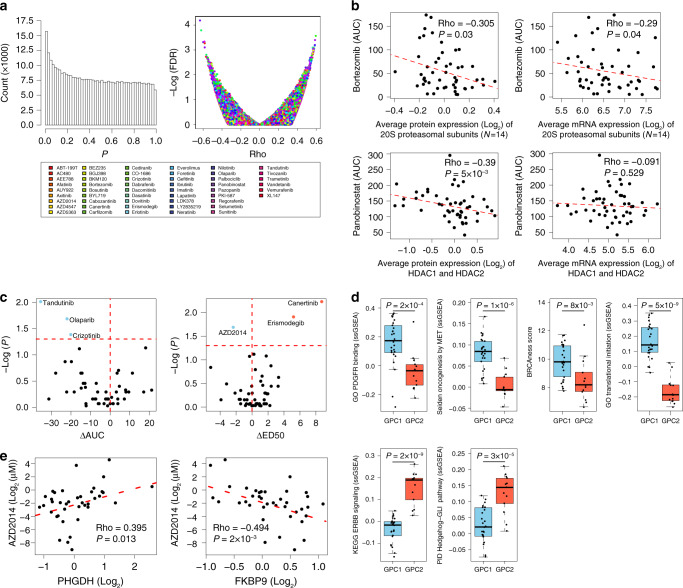
Fig. 6. Subtype-specific and biomarker-dependent sensitivities to targeted therapies.
a Correlation tests between the drug–response (AUC and ED50) and the abundance of global proteins. (Left) Histogram of P-values, and (right) FDR score distribution. Rho and P-values were obtained by Spearman’s correlation test. b Correlations between expression levels of the indicated proteins (or mRNAs) and responses to the indicated pharmacological compounds targeting them. Rho and P-values were obtained by Spearman’s correlation test. c GPC1 or GPC2-selective cytotoxicity profile of the indicated targeted therapies to patient-derived tumor cells matched to the proteomic cohort. The x axes represent differences in mean AUC (left panel) and mean ED50 (right panel) values between GPC1 and GPC2 PDCs. Statistically significant GPC1 and GPC2-selective drugs were identified by two-sided Kolmogorov–Smirnov test (P-values < 0.05; horizontal dashed line) (blue: GPC1 sensitivity, red: GPC2 sensitivity). d Subtype-specific differences in relevant gene sets to GPC1-selective (upper panels) and GPC2-selective (lower panels) drugs in c. P-values were obtained with two-sided unpaired Wilcoxon rank-sum test. The number of samples for GPC1 and GPC2 is 26 and 13, respectively. The box-and-whisker plots represent the medians (middle line), first quartiles (lower bound line), third quartiles (upper bound line) and the ±1.5× interquartile ranges (whisker lines); the raw data are overlaid. See “Methods” for details. PDGFR platelet-derived growth factor receptor. e Correlation between the expression levels of the indicated proteins and the response to the indicated pharmacological compound. Rho and P-value were obtained by Spearman’s correlation test. Source data are provided as a Source Data file.

