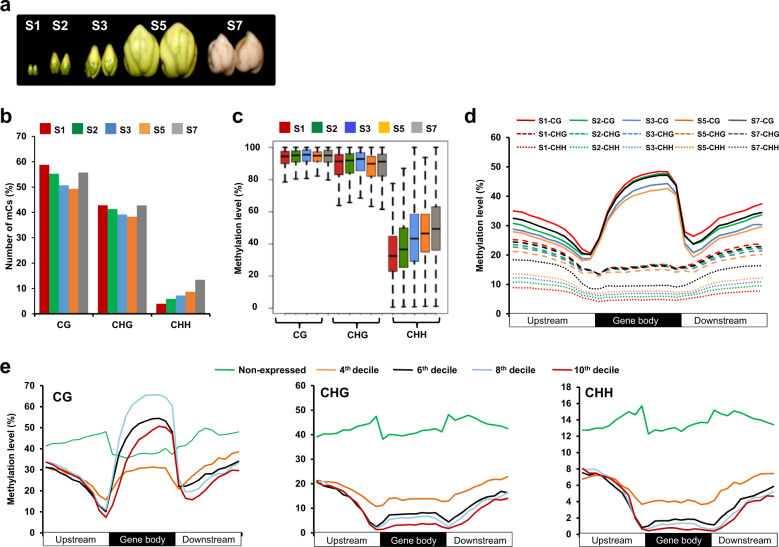
Fig. 1. Whole genome DNA methylation profiling and influence of DNA methylation on gene expression during seed development.
a Different stages of seed development, including early-embryogenesis (S1), mid-embryogenesis (S2), late-embryogenesis (S3), mid-maturation (S5), and late-maturation (S7) in JGK 3 cultivar3 used for bisulphite sequencing are shown. b Percentage of methylcytosines (mCs) in different sequence contexts (CG, CHG, and CHH) at different stages of seed development is shown in bar graph. c Methylation level at individual mC in different sequence contexts at different stages of seed development is shown via boxplot. d Methylation level within gene body and 2 kb flanking (upstream and downstream) regions in different sequence contexts for all the protein-coding genes at different stages of seed development is shown. e Methylation level within gene body and 2 kb flanking regions in different sequence contexts for the gene sets that are expressed at different levels, including non-expressed (2nd decile), low (4th decile), moderate (6th decile), high (8th decile), and highest (10th decile), at S1 stage is shown. The data for other stages of seed development are given in Supplementary Fig. 3. Each region was divided into 10 bins of equal size and normalized methylation level for the respective set of genes in each bin is shown in the line graphs in d and e.

