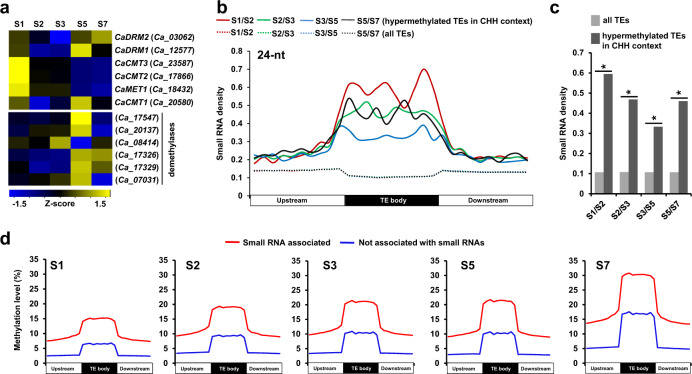
Fig. 5. Expression profiles of genes encoding DNA methyltransferases and demethylases, and analysis of small RNAs during seed development.
a Heatmap showing expression profiles of genes encoding DNA methyltransferases and demethylases during seed development. Scale represents z-score based on FPKM values. b Density of 24-nucleotide (nt) small RNAs in hypermethylated TEs in CHH context and all TEs between successive stages of seed development are shown. Each region was divided into 10 bins of equal size and normalized small RNA density (per 100 bp) in each bin is shown. c Density of 24-nt small RNAs within TE body of hypermethylated TEs in CHH context and all TEs is shown. Asterisks denote p-value < 2.2e−16 as determined by Fisher’s exact test. d Methylation level in CHH context within TE body and 2 kb flanking regions for the TEs associated with 24-nt small RNAs and not associated with small RNAs at different stages of seed development is shown. Each region was divided into 10 bins of equal size and normalized methylation level in each bin is shown.

