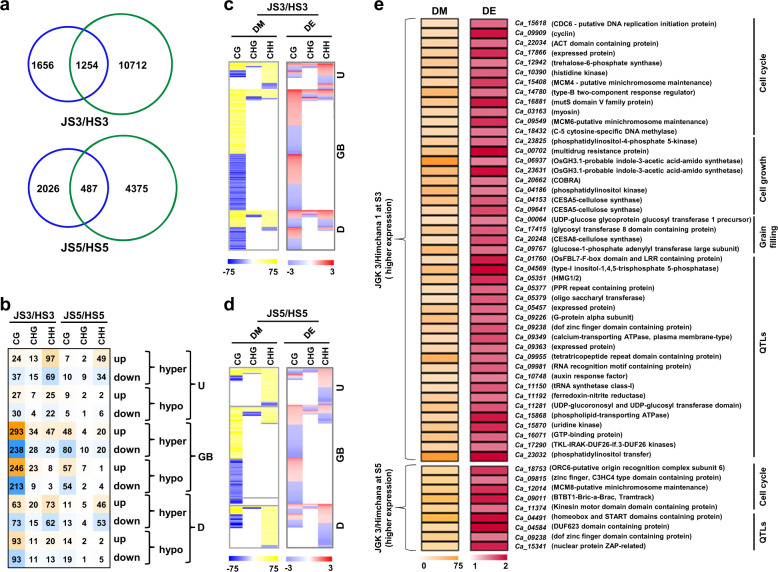
Fig. 8. Differential methylation and differential gene expression between JGK 3 and Himchana 1 chickpea cultivars.
a Number of DMR-associated (blue circle) and differentially expressed genes (green circle) between Himchana 1 and JGK 3 at S3 and S5 stages of seed development are given in Venn diagrams. b Number of differentially (hyper/hypo) methylated and differentially (up/down) expressed genes in different sequence contexts and genic regions between Himchana 1 and JGK 3 at S3 and S5 stages of seed development are shown. Intensity of mustard and blue colors indicate number of DMR-associated upregulated and downregulated genes, respectively. c, d Differential methylation (DM) and differential expression (DE) of the genes between JGK 3 and Himchana 1 at S3 (c) and S5 (d) stages of seed development given in b are shown via heatmaps. Scales at the bottom represent percentage of methylation level difference and differential expression in log2 fold-change. e Heatmap showing hypermethylation in CG context within gene body in JGK 3 (as compared to Himchana 1) associated with higher expression at S3 and/or S5 stages of seed development for sets of genes involved in cell cycle, cell growth, grain filling processes and genes located within known QTLs-associated with seed size/weight in chickpea. Scales at the bottom represent percentage of methylation level difference and differential expression in log2 fold-change. U upstream, GB gene body, D downstream.

