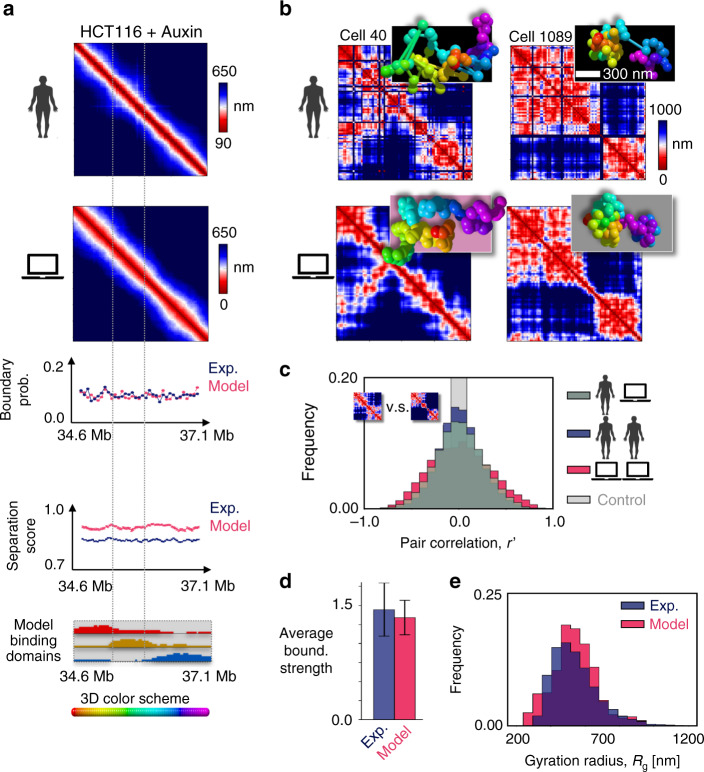
Fig. 3. Cohesin depletion tends to reverse phase separation.
a Top: In cohesin depleted HCT116 cells treated with Auxin (HCT116+ Auxin), the model predicted median distance matrix of the considered locus chr21:34.6–37.1 Mb also compares well against independent imaging data37; the Pearson and genomic-distance corrected correlations are, respectively, r = 0.96 and r′ = 0.57. A mixture of model 3D structures is required, however, 80% in the coil and 20% in the globule state. Middle: The flat domain boundary probability and separation score reflect the absence of TAD-like structures in the median matrices. Bottom: The model of the locus in cohesin depleted cells has three binding domains; their different colors are assigned by their genomic overlap with the wild-type domains of Fig. 2a. b Consistently, the RMSD based all-against-all comparison of single-cell37 (top) and model predicted (bottom) 3D structures shows that imaged conformations correspond to model structures belonging 80% to the coil (bottom left) and 20% to the globule state (bottom right, see text and Supplementary Figs. 5c, 11). The distance matrix of single molecules has non-trivial patterns in both states, but in the coil state (bottom left) contacts originate from random collisions rather than stable phase separated globule domains (bottom right). c The distribution of genomic-distance corrected correlations between distance matrices from single-cells (blue) is broader than in wild-type and its average is r′ = 0.0, highlighting a higher variability; it is statistically not distinguishable from the correlations between imaged and model distance matrices (dark gray, two-sided Mann–Whitney p value = 0.48). d In model and experiment the average boundary strength is similar (error bars s.d.), and similar to wild-type (Fig. 2d), and e the gyration radius distributions are not distinguishable too (two-sided Mann–Whitney p value = 0.10) and have a higher average value than wild-type (540 nm vs. 440 nm of Fig. 2e). The model-experiment agreement points out that cohesin depletion reverses phase separation in most cells as their corresponding model single-molecule structures are mainly in the coil rather than in the globule state, contrary to HCT116 (Fig. 2).

