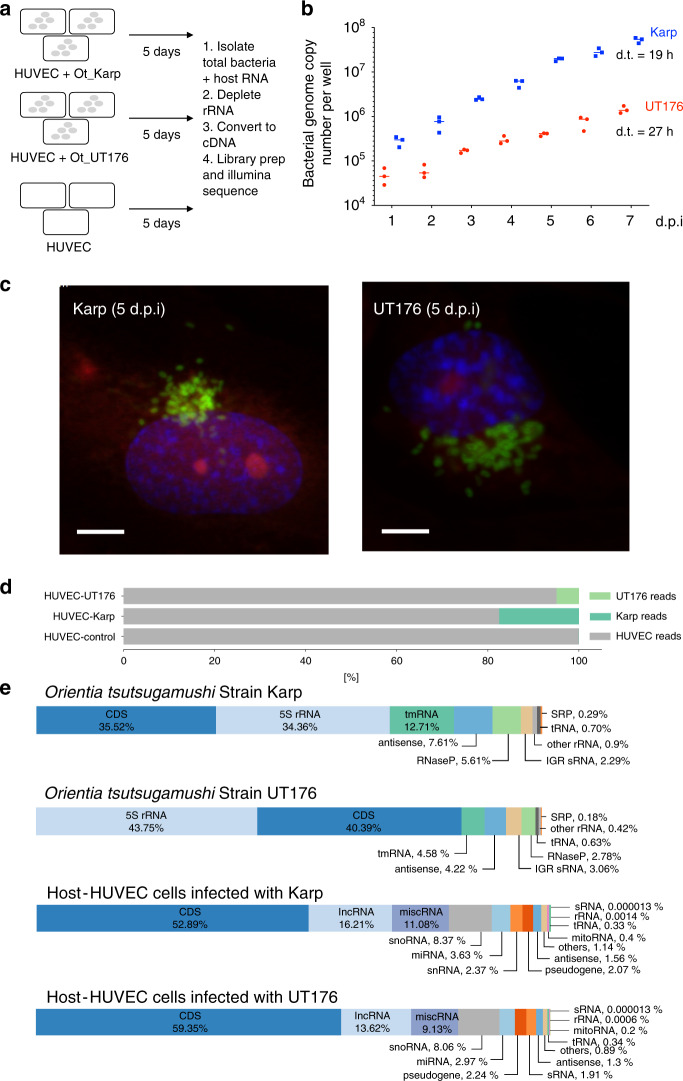
Fig. 1. Overview.
a Schematic experimental overview. HUVEC = human umbilical vein endothelial cell. b Growth curve showing replication of Ot in cultured HUVEC cells. Bacteria were grown in 24-well plates and the total bacterial genome copy number per well as measured by qPCR is shown. Bacteria were added at an multiplicity of infection (MOI) of 8:1 (UT176) and 25:1 (Karp). Mean and SD from three independent replicates are shown. c Confocal microscopy images of Ot in HUVEC cells 5 days post infection. Additional images and time points are shown in Supplementary Figs. 1 and 2. Blue = DAPI (DNA), Red = Evans blue (host cells), green = Ot labeled with Alexa488-click-methionine. Scale bar = 5 µm. d RNA mapping statistics showing the fraction of host and Ot RNA for each condition. The first replicate of the experiment is shown. Individual results for each replicate are shown in Supplementary Fig. 3. e Percentage of RNA-seq reads assigned to different classes of RNA in Karp, UT176 and HUVEC. Source data are provided as a Source Data file.

