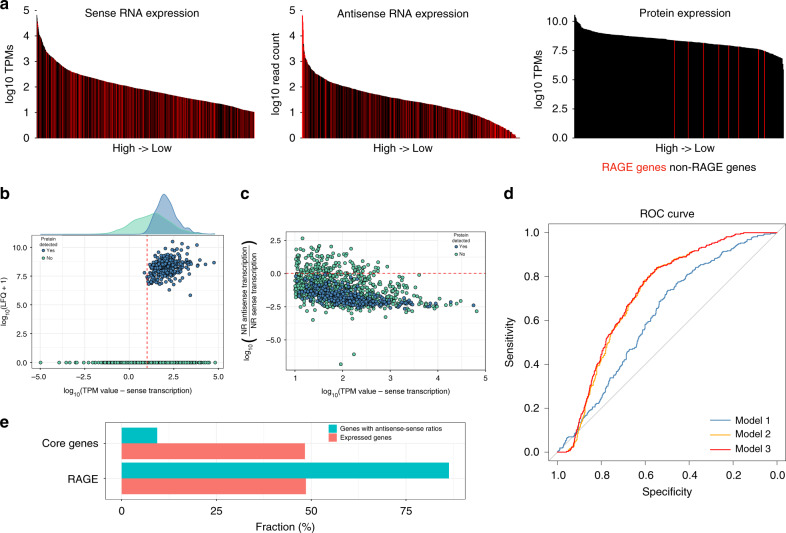
Fig. 3. Antisense transcription in Ot.
a Sense RNA expression, antisense RNA expression, and protein expression over genes, ranked from high to low; RAGE (rickettsial-amplified genetic element) genes are marked in red. b Plot showing the relationship between protein expression, defined by LFQs (label-free quantitations), and transcript expression, defined by TPMs (transcripts per million). Genes cluster into two groups based on their protein expression. The red line indicates the threshold for expressed genes (TPM value equal to 10). c Sense transcription and the ratio of reads assigned to the antisense and sense strands, showing classification based on proteomics detection. The red line indicates the sense-antisense ratio (1.06) above which translation was not detected by mass spectrometry. d ROC (receiver operating characteristic) curves evaluating the performance of logistic regression models to predict protein expression from RNA-seq read counts. Model 1 strictly uses sense expression, model 2 the antisense–sense ratio, and model 3 uses both. Incorporating antisense expression clearly improves model performance. e Fraction of core genes and RAGE genes in the set of genes with high antisense–sense ratios, compared to all expressed genes.

