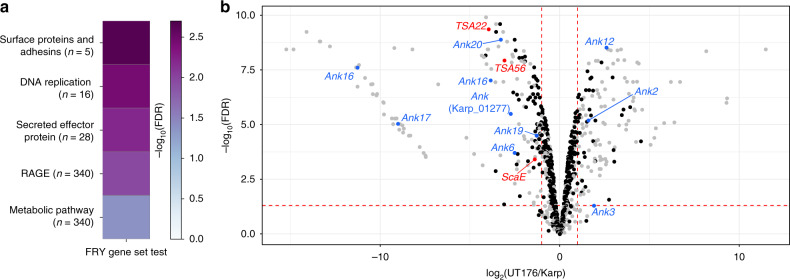
Fig. 4. Differential bacterial gene expression.
a Heatmap illustrating pathways enriched in differentially expressed genes. All illustrated categories are more highly expressed in Karp. FDR-corrected p-values were calculated using the fry gene set enrichment test in the edgeR R package. b Volcano plot showing the differential expression of bacterial genes in Karp and UT176. Bacterial surface genes (red) and ankyrin-repeat-containing effector proteins (blue) with log fold change ≥1 are highlighted. Gray dots represent RAGE (rickettsial-amplified genetic element) genes. FDR-corrected two-sided p-values were calculated using the quasi-likelihood F-test in the edgeR R package.

