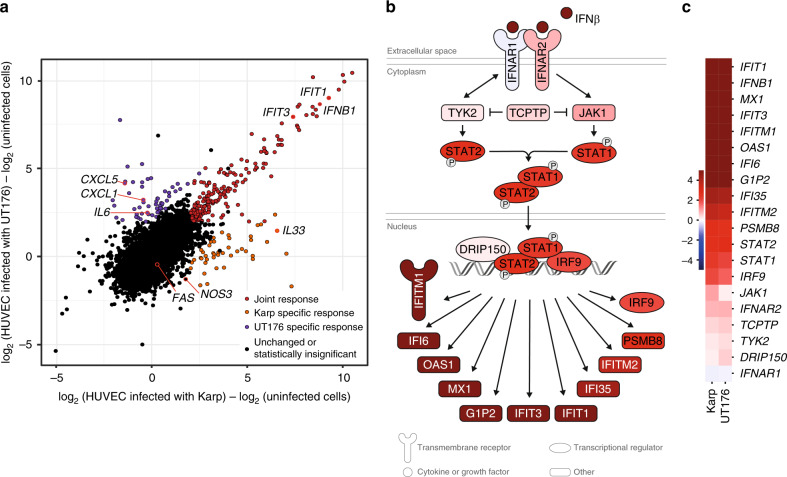
Fig. 5. Ot induces an antiviral interferon response in HUVECs.
a Summary of the host response showing joint and strain-specific responses. The joint response is defined as genes with a log2 fold change (logFC) > 2 and FDR-corrected p-value < 0.01 for infection with both Karp and UT176. Strain-specific responses are genes with a logFC > 2 and FDR-corrected p-value < 0.01 for infection with either Karp or UT176, excluding genes already included in the joint response. FDR-corrected two-sided p-values were calculated using the quasi-likelihood F-test in the edgeR R package. b Activation of multiple genes in the canonical interferon signaling pathway in Karp-infected HUVECs compared with uninfected HUVEC cells. c Heatmap showing upregulation of genes in the interferon signaling pathway in HUVEC cells infected with Karp and UT176 compared with uninfected cells. The color scale represents the logFC in gene expression.

