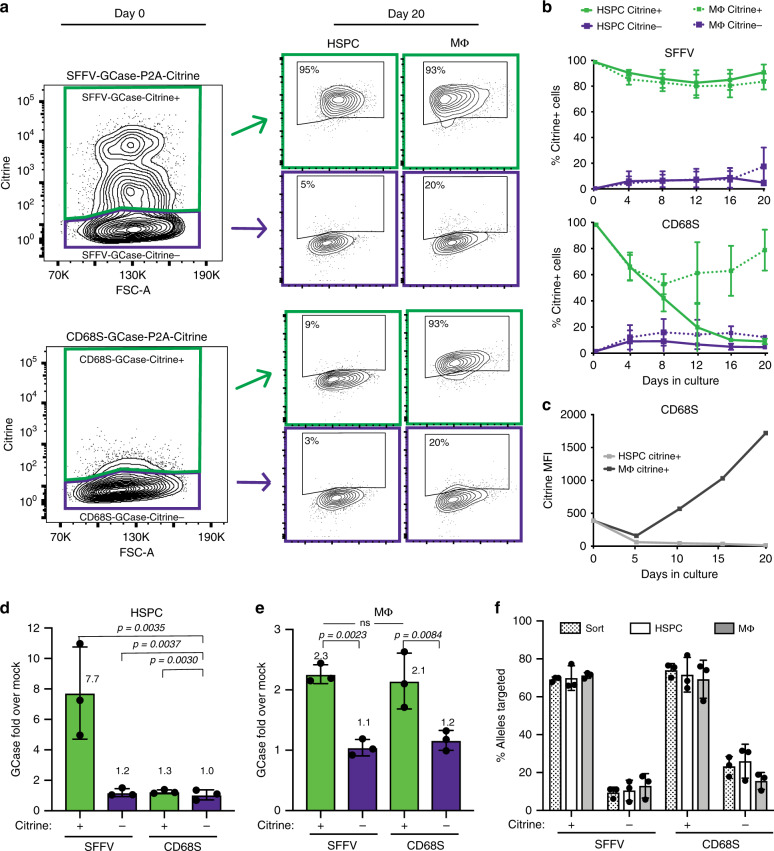
Fig. 3. CD68S promoter confines GCase expression to the monocyte/macrophage lineage.
a Representative flow plots showing Citrine+ and Citrine– populations at the time of sort (day 0, 48-h post-modification) and after 20 days in HSPC maintenance (HSPC) or macrophage differentiation (MΦ) cultures. b Citrine expression expressed as %Citrine+ cells over time in HSPC and MΦ cultures. HSPC Citrine+ (solid green line), HSPC Citrine– (solid purple line), MΦ Citrine+ (dotted green line), MΦ Citrine– (dotted purple line) (n = 3 biologically independent samples). c Representative Citrine expression expressed MFI over time in HSPC (gray) and MΦ (black) cultures in the CD68S-GCase-P2A-Citrine-targeted cells. d Fold GCase activity in HSPC and e MΦ cultures in targeted cells compared to unmodified (mock-treated) cells (n = 3 biologically independent samples). Comparisons between groups were performed using one-way ANOVA test and post-hoc comparisons were made with the Tukey’s multiple comparisons test. f Percent of targeted CCR5 alleles at the time of sort (dotted) and after 20 days in HSPC (white) and MΦ (gray) cultures (n = 3 biologically independent samples). Data shown as mean ± SD. Source data are provided as a Source Data file.

