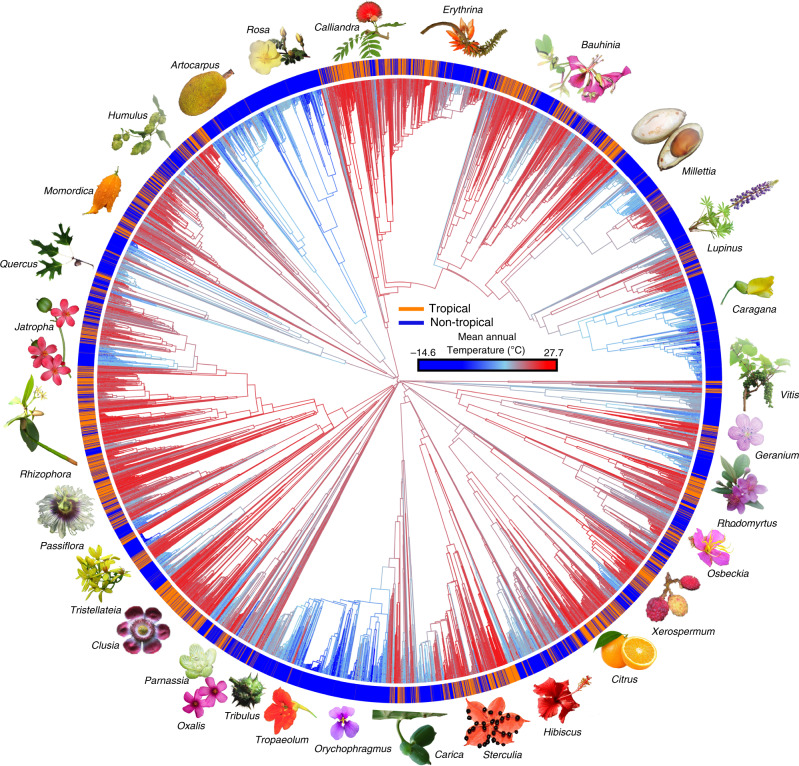
Fig. 1. Ancestral reconstruction across the rosid tree for mean annual temperature.
Branches are colored based on mean annual temperature from low (−14.6 °C; blue) to high (27.7 °C; red) values. Species tips are colored by the Köppen–Geiger climatic classification43; orange represents tropical species, and blue represents non-tropical species, based on climatic criteria; we also represent rosid diversity using icons (flower, fruit, leaves) of clade members to conceptually reflect their morphological character diversity, tropicality, and economic importance; a genus name is provided with each associated icon.

