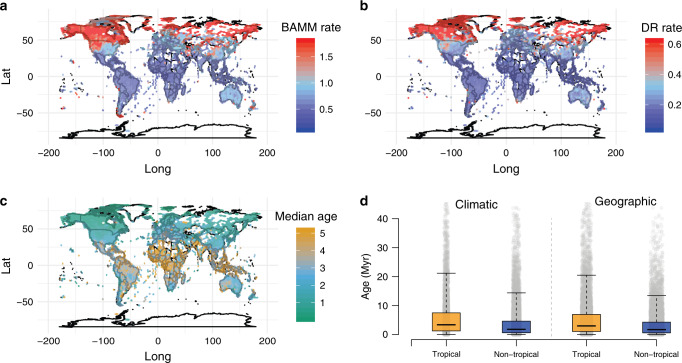
Fig. 2. Global distribution patterns of median tip rates and median species age.
Tip rates estimated by BAMM (a) and DR (b) (red = faster, and blue = slower); species tip age (c) is defined as the age of the parent node for any given tip and reported as the grid cell median (orange = older; green = younger); d boxplot of median species age for tropical (orange) and non-tropical (blue) species under both climatic and geographic definitions. t-test: both two-tailed; climatic p = 3.5518e−68 and geographic p = 2.3176e−82; median—solid line in the box, box—interquartile range [25% and 75%], whiskers—5% and 95% intervals; n = 6160, 11,475, 8870, and 9399, respectively; see gray dots for data distribution. All values in a–c are plotted in equal-area grid cells (~322 km2); source data are provided in Source Data file.

