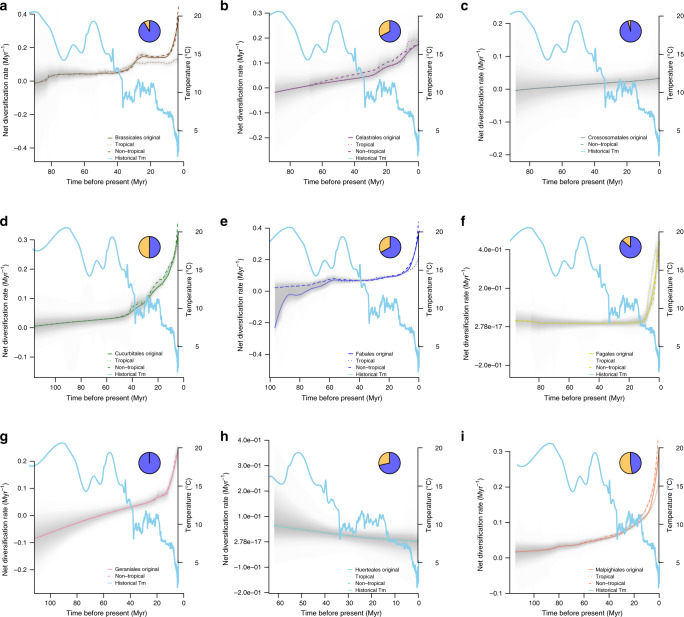
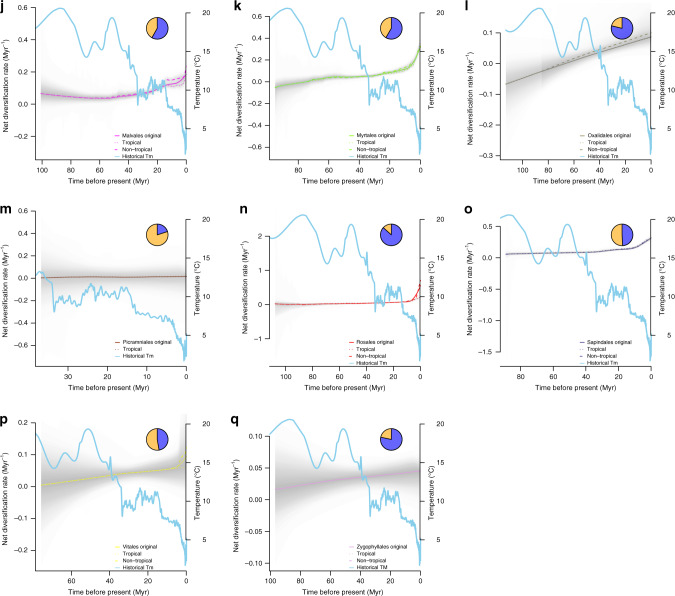
Fig. 3. Trends in net rosid diversification rate-through-time plots of tropical and non-tropical lineages against global temperature.
Net diversification rate curves were generated using BAMM for each of the 17 rosid orders (clades) (a–q); each curve is a median line colored by order; the solid line is the original net diversification rate curve, the dotted line represents the rate of tropical lineages, and the dashed line represents the rate of non-tropical lineages (no curves displayed for any lineage with sample number < 3). The gray segment is the 95% confidence interval; the sky blue line is the trend of global temperature change since the Late Cretaceous (~113 Myr), plotted as a 5-point mean derived from Cramer et al.59; the pie-chart represents the percentage of tropical (orange) and non-tropical (blue) species within each order summarized from the Köppen–Geiger climatic classification43. Each timescale (x axis) is rescaled to the clade age.


