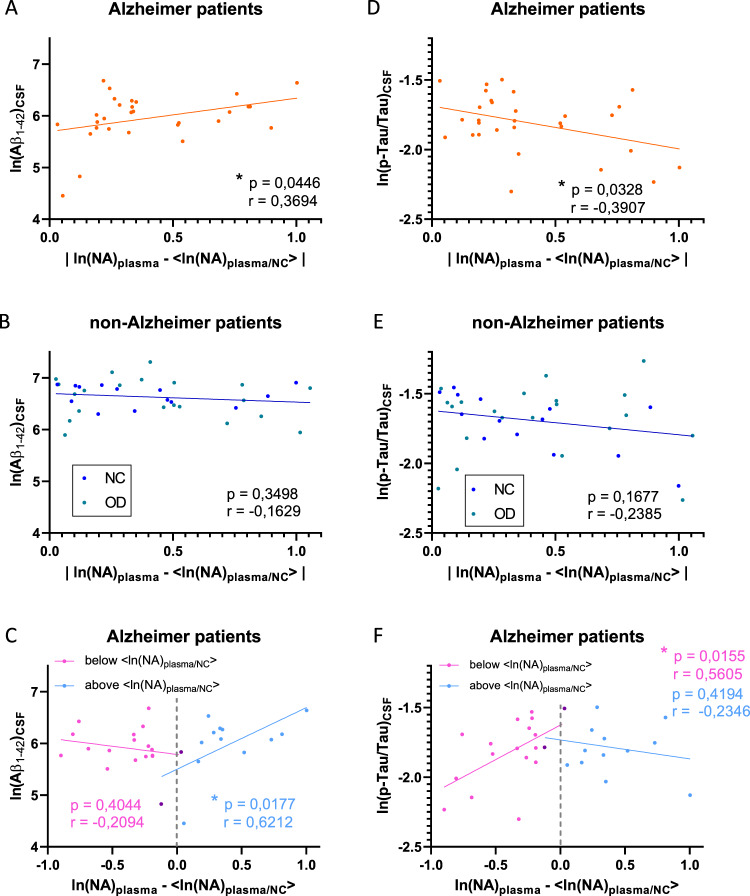
Fig. 3. Absolute [NA]plasma distance from median of NC patients correlates with [Aβ1–42]CSF and (p-Tau/Tau)CSF in AD patients.
Linear correlations between absolute distance of ln(NA)plasma from median ln(NA)plasma/NC with [Aβ1–42]CSF in AD (a) and non-AD (b) patients. c Linear correlations between negative (in pink) and positive (in blue) values of ln(NA)plasma-<ln(NA)plasma/NC>with [Aβ1–42]CSF in AD patients (points in purple were counted in both groups). Linear correlations between absolute distance of ln(NA)plasma from median ln(NA)plasma/NC with (p-Tau/Tau)CSF in AD (d) and non-AD (e) patients. f Linear correlations between negative (in pink) and positive (in blue) values of ln(NA)plasma-<ln(NA)plasma/NC>with (p-Tau/Tau)CSF in AD patients (points in purple were counted in both groups). * indicates p value < 0.05.

