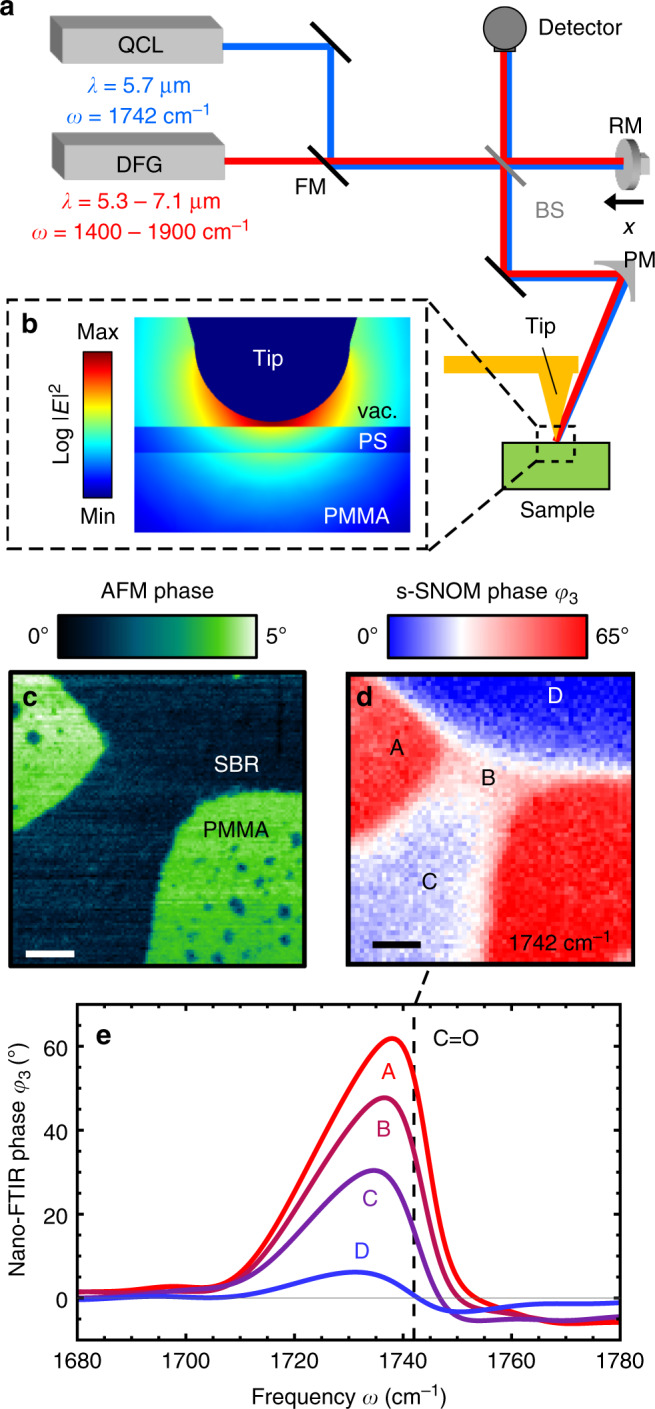
Fig. 1. Near-field imaging and spectroscopy of organic nanocomposites.

a Illustration of the s-SNOM and nano-FTIR setup. A quantum cascade laser (QCL) is used for s-SNOM imaging. An infrared laser continuum based on difference frequency generation (DFG) is used for nano-FTIR spectroscopy. The light source is selected with a flip mirror (FM). A parabolic mirror (PM) is used for focussing the laser radiation onto the tip apex. After collection of the tip-scattered light with the PM, a Michelson interferometer comprising a beam splitter (BS) and moveable reference mirror (RM) is used for detection. b Simulated near-field distribution around a tip apex (30 nm radius) above a 10 nm-thick PS layer on PMMA. For simulation details see “Methods” section. c AFM mechanical phase image of a two-component rubber blend (SBR/PMMA) and d corresponding s-SNOM phase φ3 image recorded at 1742 cm−1, which maps the absorption of the C=O vibrational mode of PMMA. Scale bar: 200 nm. e Nano-FTIR phase φ3 spectra of selected positions A–D. Vertical dashed line marks the imaging frequency.
