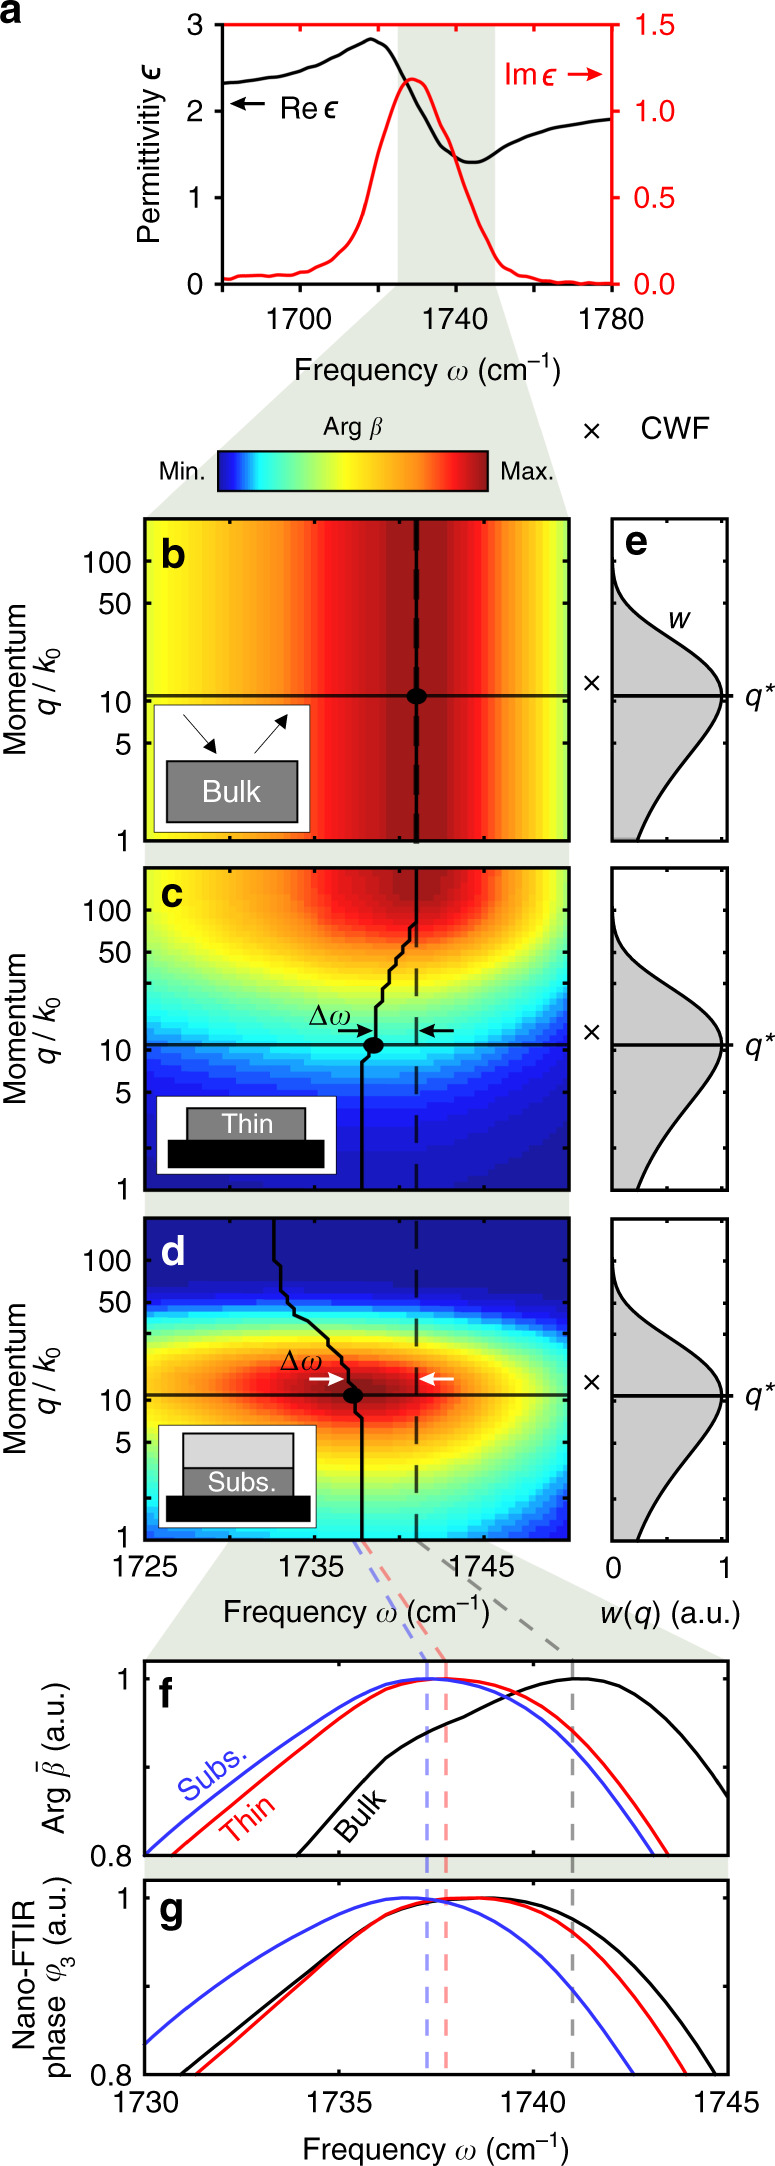
Fig. 5. Geometry- and momentum-dependent spectral shifts in nano-FTIR phase spectra.

a Real (black) and imaginary (red) parts of the dielectric function of PMMA, showing a typical Lorentz oscillator shape. Phase of the Fresnel reflection coefficient, Arg β, for different PMMA samples: b bulk PMMA, c t1 = 20 nm-thick PMMA layer at the surface of a silicon substrate, d t2 = 20 nm-thick subsurface PMMA layer at the surface of a silicon substrate and at depth d2 = 40 nm below PS. The vertical/curved solid lines indicate the frequency where Arg β has its maximum. e Coupling weight function w(q) calculated with the tip in contact with sample (H = 0). Horizontal lines indicate the momentum q* of highest tip-sample coupling. f Phase of near-field reflection coefficient, Arg , obtained by multiplying the Fresnel reflection coefficient (panels b–d) with the CWF (panel e), and integration over all momenta q. g Calculated nano-FTIR phase spectra φ3.
