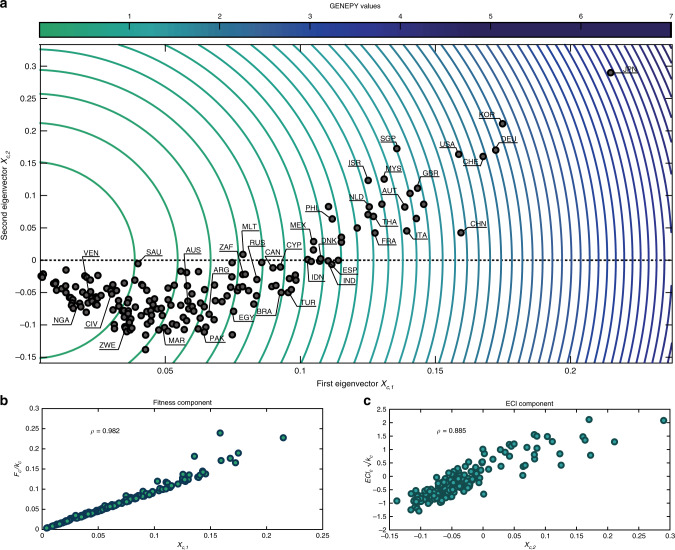
Fig. 1. The GENEPY index and its components.
a {Xc,1, Xc,2} plane and GENEPYc from the data of 2017 international products' trade. The x-axis reports the components of the first eigenvector Xc,1, whilst the y-axis the components of the second eigenvector Xc,2. The eigenvectors are normalised such that their Frobenius norm is unitary, i.e., . Contours range from lower GENEPYc values (green) to higher ones (blue). b Fitness component. Scatter plot of the first component Xc,1 compared with the values of the Fitness values Fc rescaled by the countries degree kc (see Methods section, Eq. (14)). c ECI component. Scatter plot of the second component Xc,2 compared with ECIc values rescaled by the term (see Methods section, Eq. (8)). The correlation coefficient in the plots b and c is of the Pearson’s kind. Figures have been produced with MATLAB 2019b.

