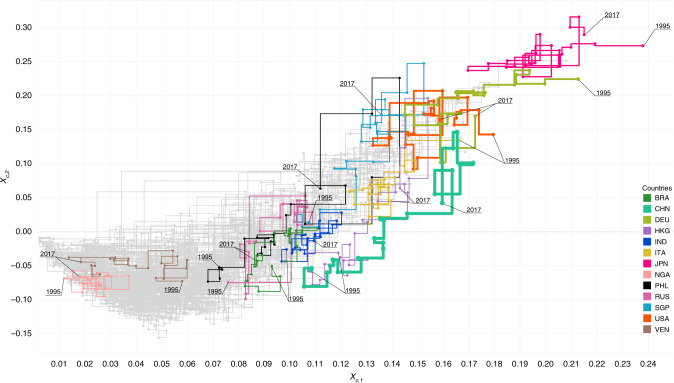
Fig. 2. Countries’ trajectories in the GENEPY plane.
The values of the first eigenvector Xc,1 are on the x-axis, whilst on the y-axis the values of the second eigenvector Xc,2 are found. The eigenvectors are normalised such that their Frobenius norm is unitary, i.e., . We highlight the trajectories of Brasil (BRA), China (CHN), Germany (DEU), Hong Kong (HKG), India (IND), Italy (ITA), Japan (JPN), Nigeria (NGA), Philippines (PHL), Russia (RUS), Singapore (SGP), United States of America (USA) and Venezuela (VEN), against the background created by trajectories of all other countries in grey. Line width reflects the countries’ share of world exports in monetary value during 2017. To improve the readability of the plot, the paths from one point to another were forced to follow right-angled movements. The figure has been produced with Tableau Public 2019.4.

