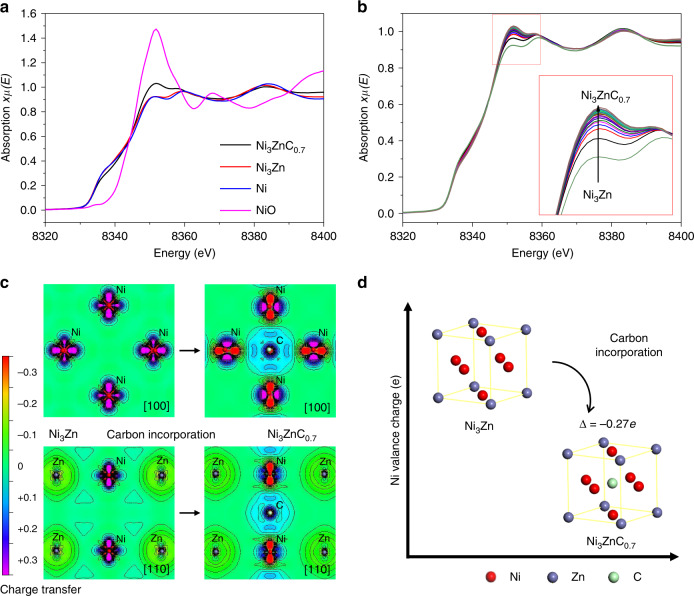
Fig. 4. Electronic structure of Ni in Ni3Zn and Ni3ZnC0.7.
a Normalized Ni K-edge XANES spectra of NiO (pink curve), Ni foil (blue curve), Ni3Zn (red curve), and Ni3ZnC0.7 (black curve), respectively. b In situ Ni K-edge XANES spectra during the process from Ni3Zn to Ni3ZnC0.7 under 1.0 vol% C2H2/He atmosphere at 200 °C. c Charge density difference plots of the interface along [100] and [110] directions of Ni3Zn and Ni3ZnC0.7. d The charge density variation of Ni when transformed from Ni3Zn to Ni3ZnC0.7. Δ represents that the introduction of C to Ni3Zn renders Ni with an electron deficiency of −0.27 per atom.

