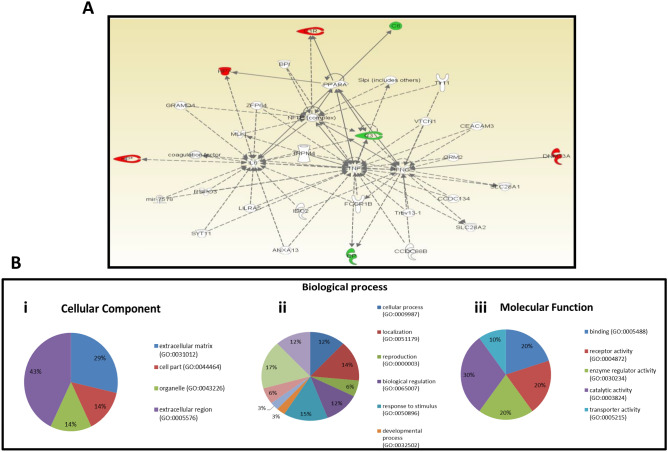
Figure 4.
Protein interaction network and function. (A) Ingenuity Pathway Analysis (IPA) showing the major protein interaction network of identified proteins. Direct interactions are represented as solid lines, whereas indirect interactions appear as dotted lines. (B) A representative pie charts indicating the cellular localization (i), role of the identified proteins in the biological and physiological systems (ii) and the molecular functions of differentially identified proteins (iii). A total of six biological processes with their respective cellular locations were categorized.

