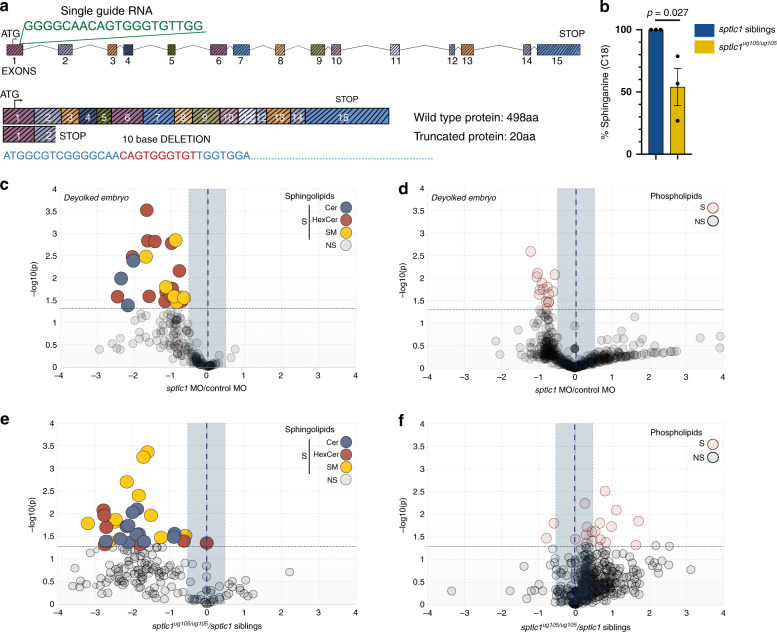
Fig. 3. sptlc1-deficient embryos exhibit low levels of sphingolipids.
a Structure of zebrafish sptlc1 gene. Single-guide RNA used is shown in green. The sequence deleted in the CRISPR/Cas9 mutant is shown in red in the annotated sptlc1 sequence. b Graph showing the relative amounts of C18 sphinganine in 4 dpf sptlc1ug105/ug105 normalized to the average of the amounts of C18 sphinganine in their siblings. Data are represented as the mean value +/- SEM from three independent experiments. Unpaired, two-tailed student’s t-test was used. c–f Volcano plots of lipidomic data from three (c, d) or two (e, f) independent experiments showing either sphingolipids in deyolked embryos for sptlc1 morphants at gastrula stages (c) or in 4 dpf sptlc1ug105/ug105 mutants (e) or phospholipids in deyolked embryos for sptlc1 morphants at gastrula stages (d) and 4 dpf sptlc1ug105/ug105 mutants (f). Horizontal dashed line thresholds significance (p-value = 0.05). NS (statistically non-significant); S (statistically significant). An unpaired, two-tailed student’s t-test was used for analysis of sptlc1 morphants. A paired, two-tailed student’s t-test was used for sptlc1 mutants. Blue shadowed area delimits +/–1.5-fold difference abundance with respect to control. Relevant changes in the decrease of the content of a lipid species are located in the upper left quadrant. Each dot corresponds to an individual lipid species. Note that phospholipids downregulated in deyolked sptlc1 morphants and upregulated in sptlc1ug105/ug105 mutants correspond mainly to PE and minor PI species (for details see Supplementary Fig. 5e, h). Lipid amounts were normalized as pmol/nmol inorganic phosphate (see “Methods”). Source data are provided as a Source Data file.

