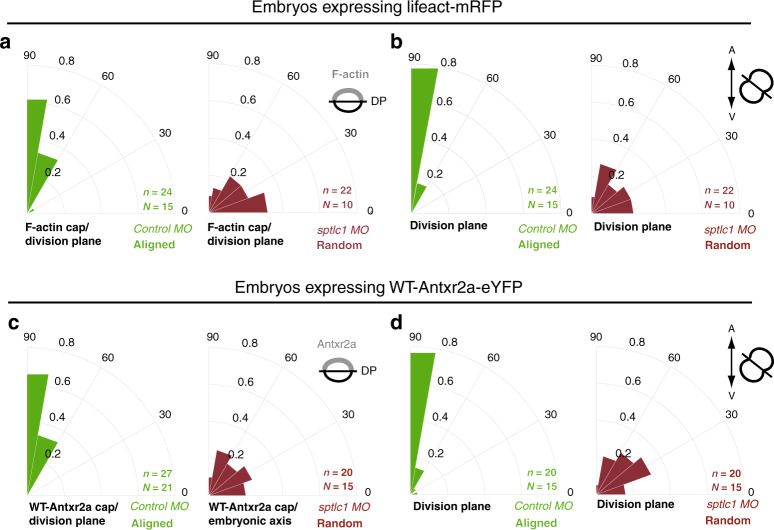
Fig. 6. Alignment of F-actin and Antxr2a caps with the division plane requires sphingolipids.
a, c Polar graphs showing the frequency distribution of the angle between the F-actin cap (a) or the Antxr2a cap (c) with respect to the mitotic plane (green line in Fig. 5b, e). b, d Polar graphs showing the frequency distribution of the angle between the plane of division and the plane of the embryonic axis in epiblast cells expressing either Lifeact-mRFP biosensor (b) or Antxr2a-eYFP (d) in control and sptlc1 morphant embryos. χ2 test was used (see Supplementary Table 1). n (number of cells analyzed) over N (number of embryos). DP division plane. Source data are provided as a Source Data file.

