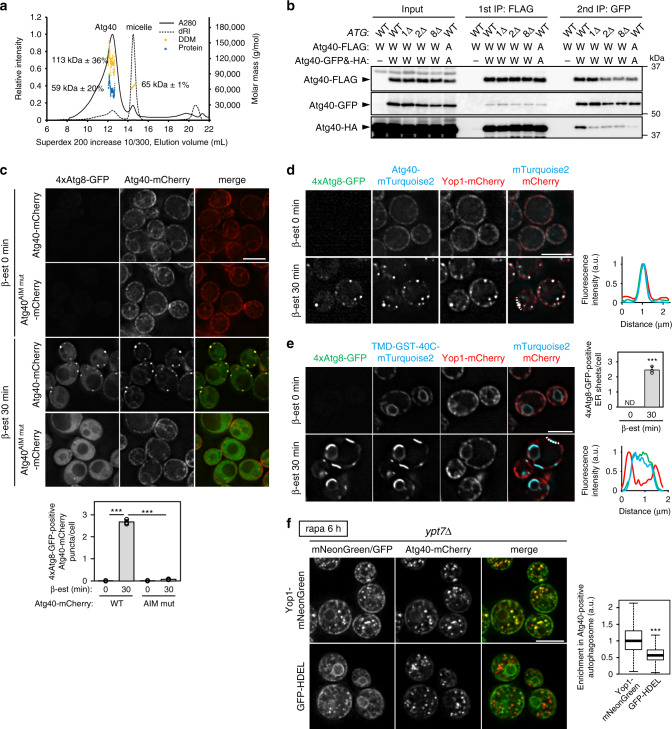
Fig. 4. Super-assembly of Atg40 generates ER membrane condensates with highly curved regions.
a Purified Atg40-6His (30.6 kDa) solubilized in n-dodecyl-β-d-maltoside (DDM) was subjected to SEC-MALS analysis (see “Methods”). dRI differential refractive index. b Cells coexpressing Atg40-FLAG, Atg40-GFP, and Atg40-HA under the ATG40 promoter were treated with rapamycin for 6 h, and cell lysates (input) were subjected to immunoprecipitation using anti-FLAG antibody-conjugated beads. Bound proteins were eluted with the FLAG peptide, and the eluates were subjected to a second immunoprecipitation using anti-GFP antibody. W, wild-type Atg40; A, the AIM mutant of Atg40. The experiments were performed independently three times. c Cells constitutively expressing Atg40-mCherry under the ADH promoter were treated with β-estradiol to induce expression of GFP-fused, tandemly repeated Atg8G116A (4 × Atg8-GFP), and analyzed by fluorescence microscopy. The quantification results are shown as means ± s.d. (n = 3). d, e Assembly of Atg40-mTurquoise2 (c) or TMD-GST-40C-mTurquoise2 (d) was induced by expressing 4×Atg8-GFP. Enrichment of Yop1-mCherry in the assemblies was analyzed by fluorescence microscopy. Line scan analysis of dashed line shows the normalized fluorescence intensity. The quantification results are shown as means ± s.d. (n = 3). f Enrichment of Yop1-mNeonGreen and GFP-HDEL in Atg40-positive autophagosomes was analyzed by fluorescence microscopy. The images are maximum-intensity projections of Z stacks (11 plane stacks, 0.2-μm spacing). Box plots (center line, median; box limits, upper and lower quartiles; whiskers, 1.5 × interquartile range) show Yop1-mNeonGreen/GFP-HDEL signals in those autophagosomes against the entire signals (see “Methods”). ***P = 1.68 × 10⁻⁶ (c, WT 0 min vs WT 30 min), ***P = 1.91 × 10⁻⁶ (c, WT 30 min vs AIM mut 30 min), ***P = 4.58 × 10⁻⁵ (e) (unpaired two-tailed Student’s t test); ***P = 2.2 × 10⁻¹⁶ (f) (unpaired two-tailed Mann–Whitney U test). Scale bars, 5 μm.

