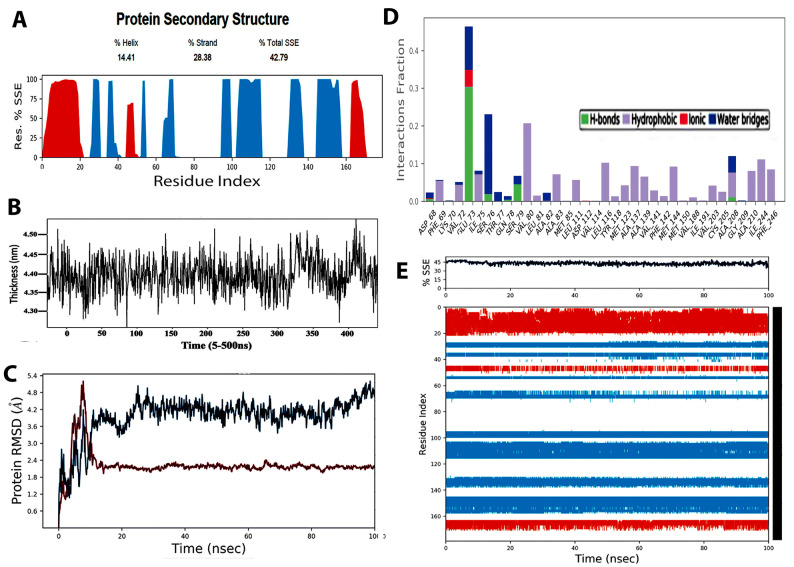
Figure 2.
(A) Protein secondary structure elements (SSE) including alpha-helices and beta-strands were monitored throughout the simulation. The plot represents SSE distribution by residue index throughout the protein structure. All protein frames were first aligned on the reference frame backbone. Energy minimization was ensured to avoid inappropriate geometry and against steric clashes. Typically, it is observed that the tails (N- and C-terminal) fluctuate more than any other part of the protein. Secondary structure elements such as alpha helices and beta strands are usually more rigid than the unstructured part of the protein, and thus fluctuate less than the loop regions. (B) Restrictive simulation process of the lipid membrane with interaction energy and contact with the membrane. This was presented as the morphology of the upper lipid membrane layer with average z coordinate value of the surface set to 0. (C) The RMSD was calculated based on atom selection. Monitoring the RMSD of a protein provides insights into its structural conformation throughout the simulation. RMSD analysis indicates if the simulation has equilibrated; its fluctuations towards the end of the simulation are around thermal average structure. Since many molecules dock into the binding pocket, the spheres formed within 0.1–0.3 nm root mean square division established the crystal structure and maximum orientations. Changes in the order of 0.1–0.3 nm are acceptable for small, globular proteins. Changes larger than that value, however, indicate that the Sortase A protein undergoes a large conformational change during the simulation. Ligand RMSD (right Y-axis) indicates how stable the ligand is with respect to the protein and its binding pocket. (D) The stacked bar charts are normalized over the course of the trajectory: for example, a value of 0.7 suggests that 70% of the simulation time the specific interaction is maintained. Values over 1.0 are possible as some protein residue may make multiple contacts of same subtype with the ligand. The plot summarizes the SSE composition for each trajectory frame over the course of the simulation (E) The plot below summarizes the SSE composition for each trajectory frame over the course of the simulation.

