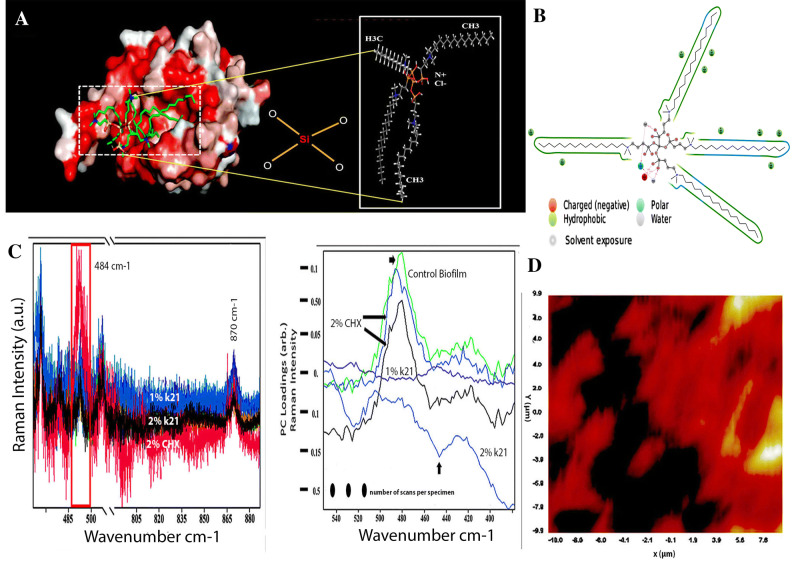
Figure 3.
(A) Results of molecular docking simulation of QAS 1% on crystal structure of SrtA indicating a complex indicating a predicated interaction mode of QAS catalytic center of SrtA. The structure was generated from molecular coordinates from the Protein Data Bank, PDB ID. Subset proposed chemical formula of the QAS molecule. The docking shown in figure is typically performed on the basis of the known Sortase-A crystal structure and the SrtA-quaternary ammonium substrate complexes. The polar capabilities of QAS has enabled it to form charge-charge interactions that can insert with the binding pocket of SrT-A. (B) A schematic of detailed ligand atom interactions with the protein residues. Interactions that occur more than 5.0% of the simulation time in the selected trajectory (0.00 through 100.00 ns), are shown. (C) Raman spectra of dual specie biofilms grown on demineralized dentine specimens and treated with different concentrations of QAS and CHX disinfectants. Spectral differences of control and treated specimens can be seen in the 484 cm−1 region after normalization. Labelled bands present in the spectra are discussed in the text. Spectra are shifted to avoid overlap between the groups. The spectral lines are quantitative detection with each data point corresponding to the average signal collected from different groups. Raman spectra and the corresponding section corrected for orientation in a side-by-side image. For better comparability of the two measurements, different colours were chosen for the Raman spectrum of the dual specie bacterial biofilms. The molecules within the aromatic and functional groups have polarized electrons as a result of double bonds and free electrons which resulted in increased Raman shifts inside the specimens. The bands refer to the glycosidic link or ring breath of possible polysaccharides which typify the changes seen within the biofilm as a result of disinfectant treatment. These features are specific for polysaccharides (COC stretching and the anomeric C (1)-H deformations of α (1 → 4) glycosidic links) linked by 1–4 glycosidic bonds (amylose, amylopectin, glycogen). This finger print region attributed to bacterial carbohydrate via CO and CC stretching and bending vibrations showing similar changes as per our previous studies, this time also with 1% QAS molecules. (D) Raman image of intact dual specie cells with dark shading representing peak intensities at 484 cm−1 region corresponding loadings plot.

