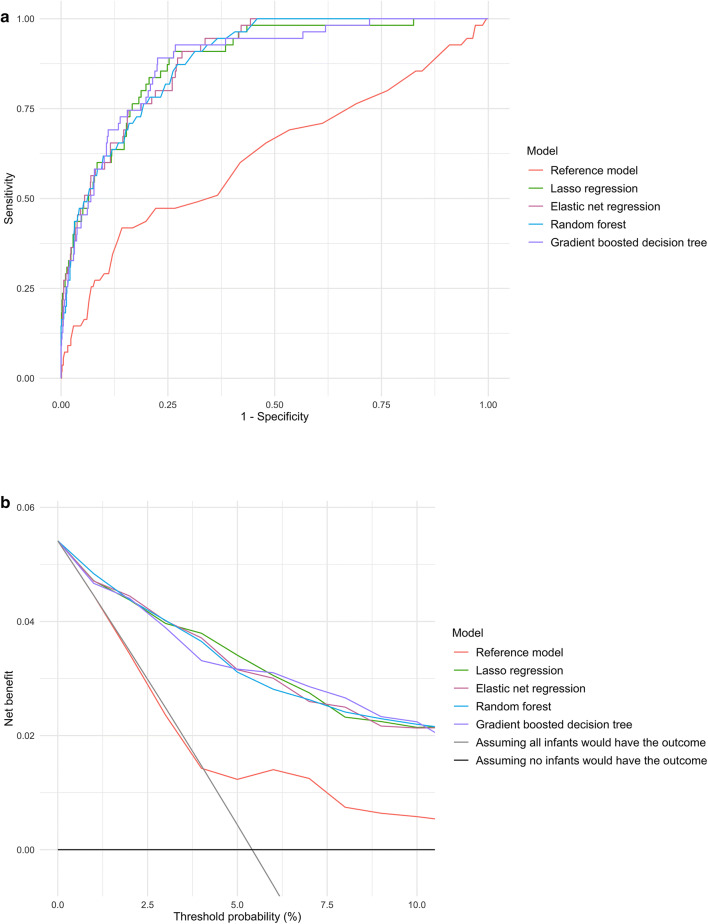
Figure 1.
Prediction ability of the reference and machine learning models for positive pressure ventilation outcome in the overall cross-validation dataset. (A) Receiver-operating-characteristics (ROC) curves. The corresponding value of the area under the receiver-operating-characteristics curve (AUC) for each model are presented in Table 2. (B) Decision curve analysis. X-axis indicates the threshold probability for positive pressure ventilation outcome; Y-axis indicates the net benefit. Compared to the reference model, the net benefit of all machine learning models was larger over the range of clinical threshold.

