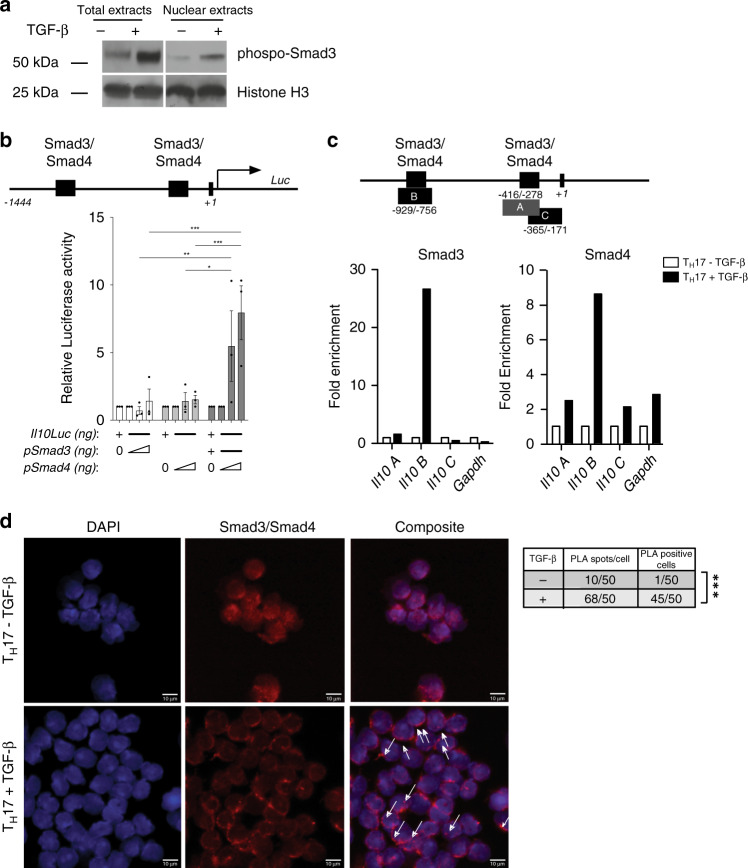
Fig. 6. Smad3 and Smad4 activate Il10 transcription in TH17 cells.
a Western blot of TH17 cell-total/nuclear extracts challenged with or without TGF-β for 30 min. One representative experiment out of two is shown. b Schematic representation of the proximal murine Il10 promoter (from −1444 to +1 bp) driving the expression of the luciferase reporter gene (luc). The predicted binding sites for Smad3 and Smad4 as well as the Il10 TSS are depicted (top). Relative Luc activity driven by Smad3 and Smad4 on proximal Il10 promoter (bottom). Mean ± SEM (n = 3). *P < 0.05, **P < 0.01, and ***P < 0.001 by ordinary two-way ANOVA and Tukey’s multiple comparisons test. c Schematic representation of the proximal murine Il10 promoter (from −1444 to +1 bp) indicating the predicted binding sites for Smad3 and Smad4 and the depicted amplicons A (from −416 to −278 bp), B (from −929 to −756 bp), and C (from −365 to −171 bp) (top) that were used to amplify the chromatin Immunoprecipitated DNA. Smad3 and Smad4 Chromatin immunoprecipitation (ChIP) of sorted TH17 cells challenged with or without TGF-β (bottom). One representative experiment out of three is shown. d Proximity Ligation Assay (PLA) using sorted TH17 cells challenged with or without TGF-β. White arrows indicate positive Smad3/Smad4 interaction signal (red dots) superimposed on nuclei stained with DAPI (blue). Scale bar represents 10 μm. Number of PLA spots per cell and the number of PLA positive cells are reported in the box. One representative experiment out of two is shown. ***P < 0.001 for comparison by χ2 test. Source data are provided as a Source data file.

