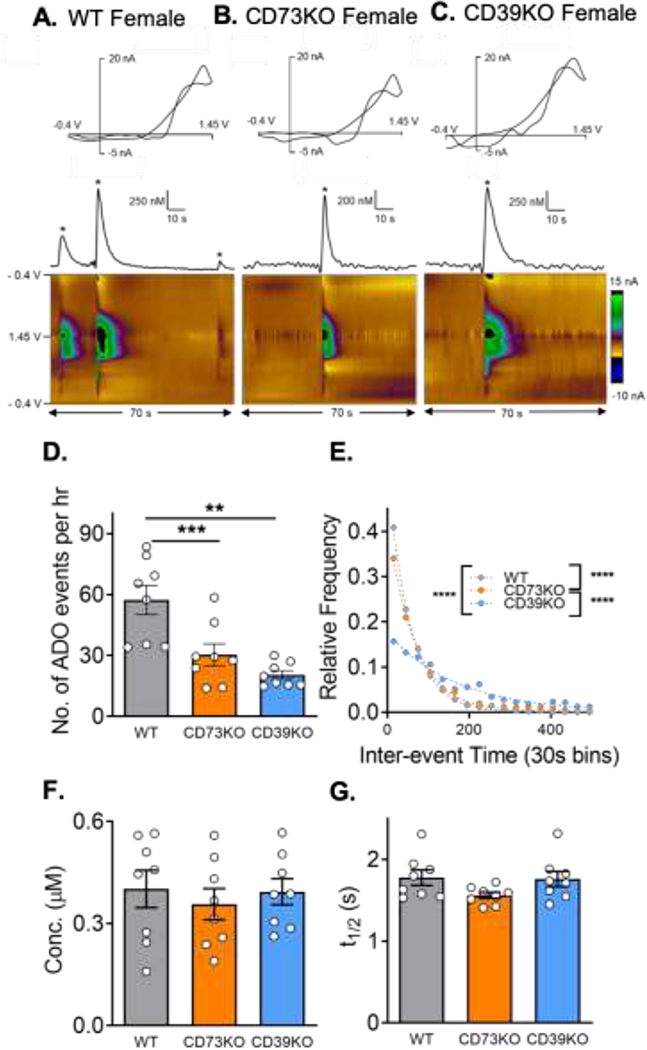
Figure 1. Spontaneous adenosine in the hippocampus.
Example adenosine events in females of (A) wild-type (B) CD73KO, and (C) CD39KO mice. Adenosine can be identified in cyclic voltammograms (top) by its primary oxidation peak at 1.3 V on the cathodic scan and secondary oxidation peak at 1.2 V on the anodic scan. Concentration vs. time traces (middle) were derived from corresponding 3-D color plots (bottom). Adenosine oxidations are the green/purple area in the middle of the color plot. (D) Number of adenosine events per hour (One-way ANOVA, n = 8 animals (4M/4F)/genotype, overall effect p = 0.0002, Tukey’s test, ** p<0.01, ***p < 0.001). (E) Inter-event time distributions. The underlying inter-event time distributions of adenosine were significantly different (Kruskal-Wallis test, overall effect p < 0.0001, Dunn’s test, **** p < 0.0001). (F) Mean concentrations of each adenosine event did not vary by geneotype (One-way ANOVA, n = 8 animals/genotype, p = 0.77). (G) Average t1/2 did not significantly differ by genotype (One-way ANOVA, n = 8 animals/genotype, p = 0.13).

