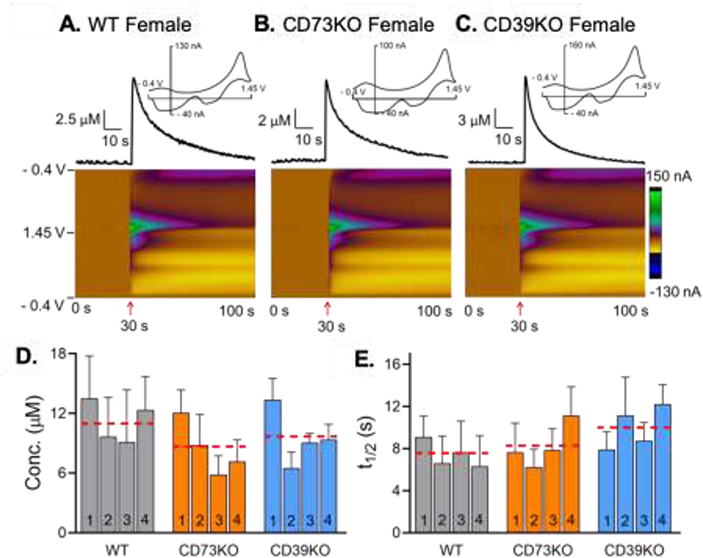
Figure 2. Mechanically-stimulated adenosine in the hippocampus.
Example of mechanically-stimulated adenosine in female (A) wild-type, (B) CD73KO, and (C) CD39KO mice. Electrode was lowered 0.1 mm at 30 s (arrow). Concentration vs. time traces show the peak concentration of adenosine. Four consecutive stimulations were performed every 15 min for totally 4 stimulations. (D) Concentration of mechanically-stimulated adenosine, shown by stimulation number. Red dashed lines are the average for all 4 stimulations for each genotype. There was no significant effect of genotypes or stimulation number on concentration of mechanically-stimulated adenosine (Two-way repeated measure ANOVA, n = 8 animals (4M and 4F)/genotype, p = 0.65 and p = 0.072, respectively). (E) t1/2 of mechanically-stimulated adenosine, by stimulation number. Red line is average for all stimulations. There was no significant effect of genotypes or stimulation number on t1/2 of mechanically-stimulated adenosine (Two-way repeated measure ANOVA, n=8 (4M/4F) p = 0.43 and p = 0.71, respectively).

