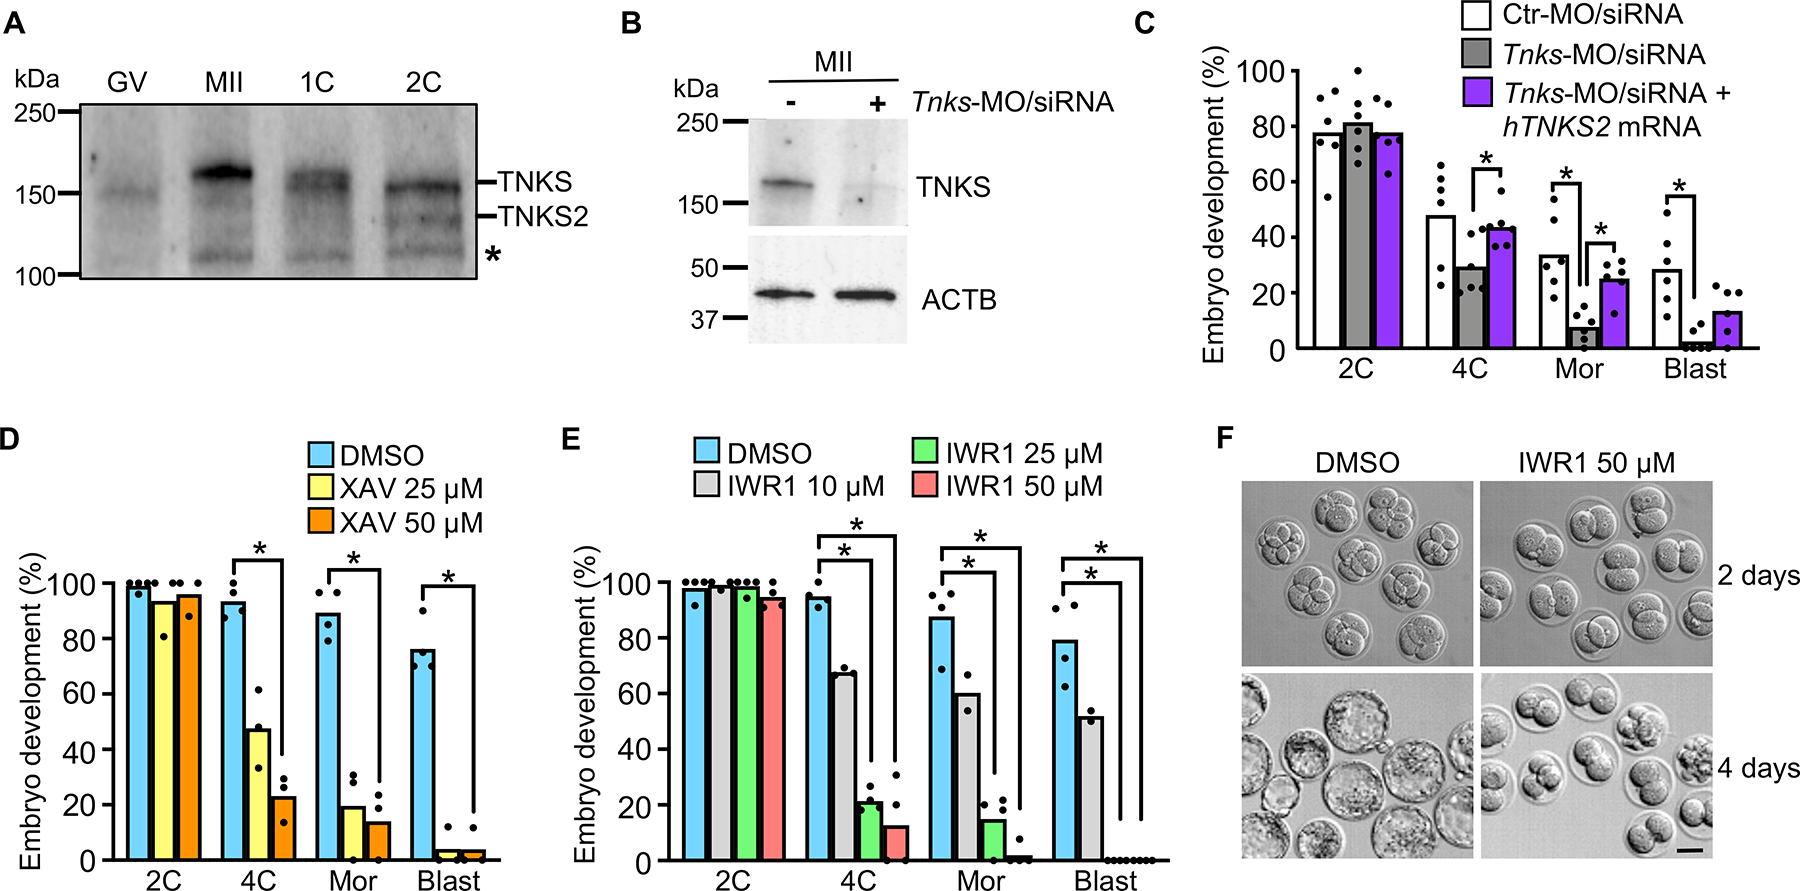
Figure 1. Tankyrase activity is essential for preimplantation embryo development.

(A) Immunoblot of TNKS and TNKS2. N=3; 50 oocytes/eggs/embryos per lane. Asterisk indicates non-specific band. (B) Immunoblot analysis of TNKS in eggs following microinjection at the GV stage using the indicated combination of morpholino (MO) and siRNA (upper panel). β-actin, loading control (lower panel). N=2; 58 eggs/lane in representative blot shown. (C) Percentage of fertilized embryos to reach specified stages following microinjection at the GV stage with the indicated morpholino/siRNA/mRNA combination. N=6, 21–67 1C embryos/group/replicate; *p<0.05, ANOVA with Dunnett’s. (D) Percentage of 1C embryos to reach specified stages following culture with XAV939. N=4; 16–38 1C embryos/group/replicate; *p<0.05, Kruskal-Wallis with Dunn’s. (E) Percentage of 1C embryos to reach specified stages following culture with IWR1. N=3; 16–33 1C embryos/group/replicate; *p<0.05, Kruskal-Wallis with Dunn’s. (F) Embryos at 2 days and 4 days following culture from 1C stage in DMSO or IWR1. Scale bar=40 μm. Median or mean, as appropriate, and all values shown in graphs. Abbreviations in this and all subsequent figures: GV, GV-intact oocyte; MII, MII-arrested egg; 1C, one-cell embryo; 2C, two-cell embryo; 4C, four-cell embryo; 8C, eight-cell embryo; Mor, morula; Blast, blastocyst.
See also Figures S1 and S2.
