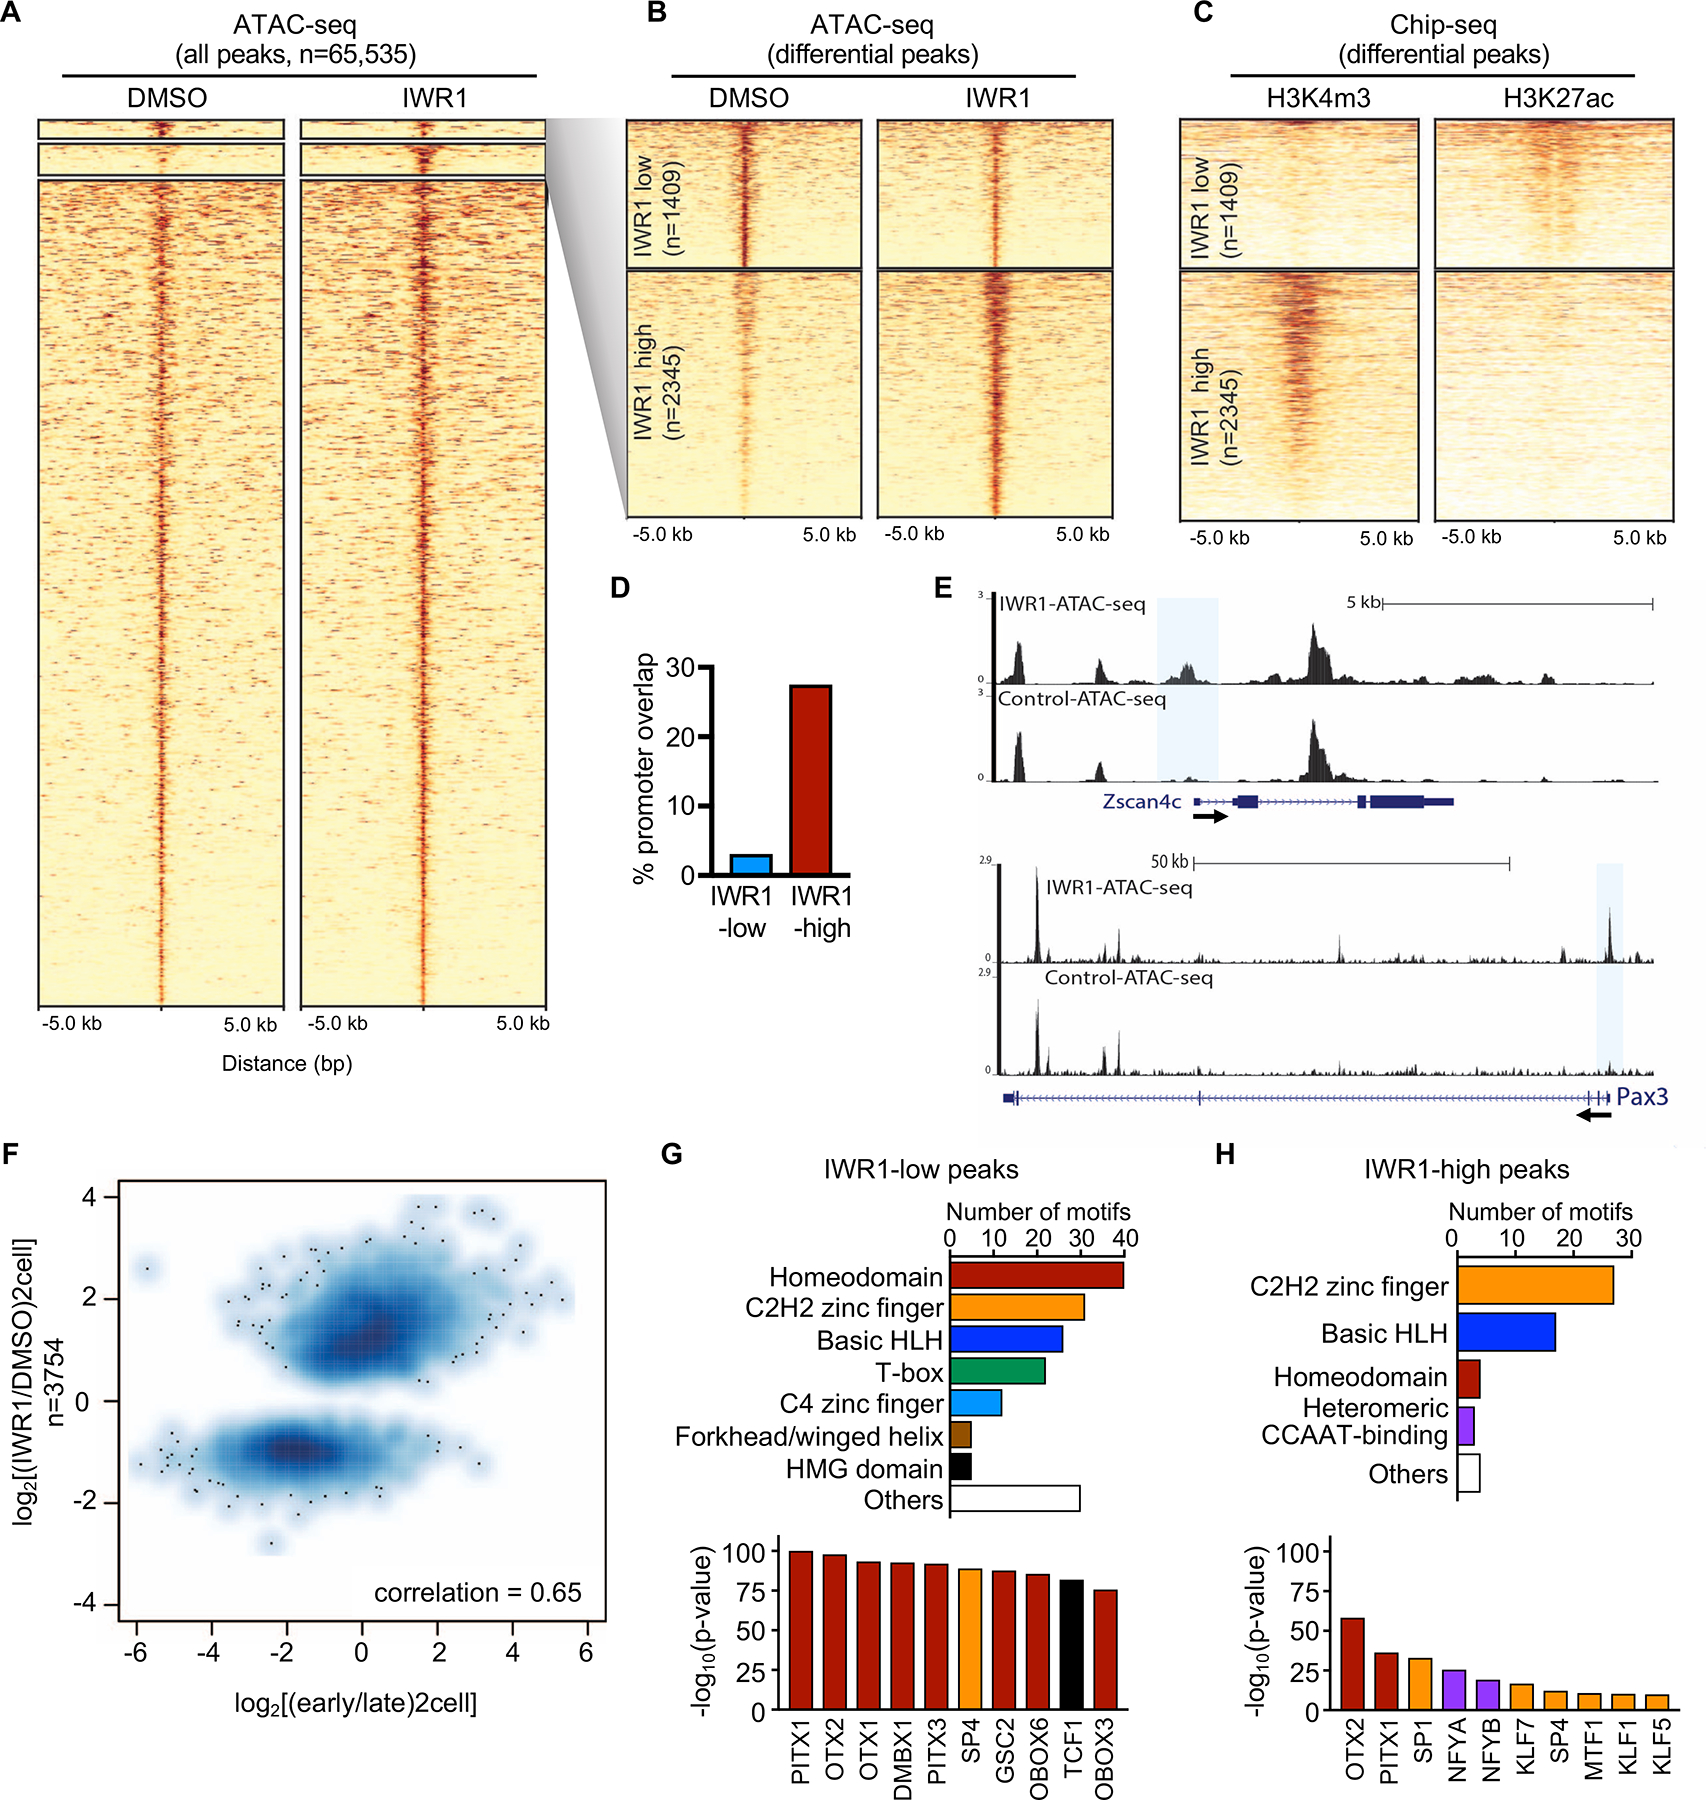
Figure 3. Tankyrase activity is necessary to generate the appropriate chromatin status for EGA.

(A) Heatmap of ATAC-seq of 2C stage embryos treated with IWR1 or DMSO beginning at the 1C stage (22–23 hrs post-hCG) and cultured until the late 2C stage (48 hrs post-hCG). High confidence peaks (n=65,535) filtered for differential ATAC-seq signal. (B) Heatmap of differential ATAC-seq peaks (expanded from A) showing IWR1-low and IWR1-high peaks at FDR<0.05 using DESeq2. (C) Heatmap of ChIP-seq data from (Dahl et al., 2016) using late 2C-stage mouse embryos. Left, H3K4me3 ChIP-seq; Right: H3K27ac ChIP-seq. (D) Percentage of differential ATAC-seq peaks that overlap with promoter regions. (E) Genome browser snapshots showing ATAC-seq peaks in IWR1 or DMSO treated 2C embryos for EGA genes Zscan4c and Pax3. Differential open promoters highlighted by blue boxes. (F) Scatterplot of ATAC-seq IWR1 vs. DMSO differential peaks compared to early vs. late 2C ATAC-seq from (Wu et al., 2016). Strong positive correlation = 0.65. (G,H) Motif analysis of IWR1-low (G) and IWR1-high (H) peak regions. Upper panels: Total number of significantly enriched motifs in the indicated transcription factor family. Lower panels: Most significantly enriched motifs. Bars color-coded to match motif families in upper panels.
See also Figure S3.
