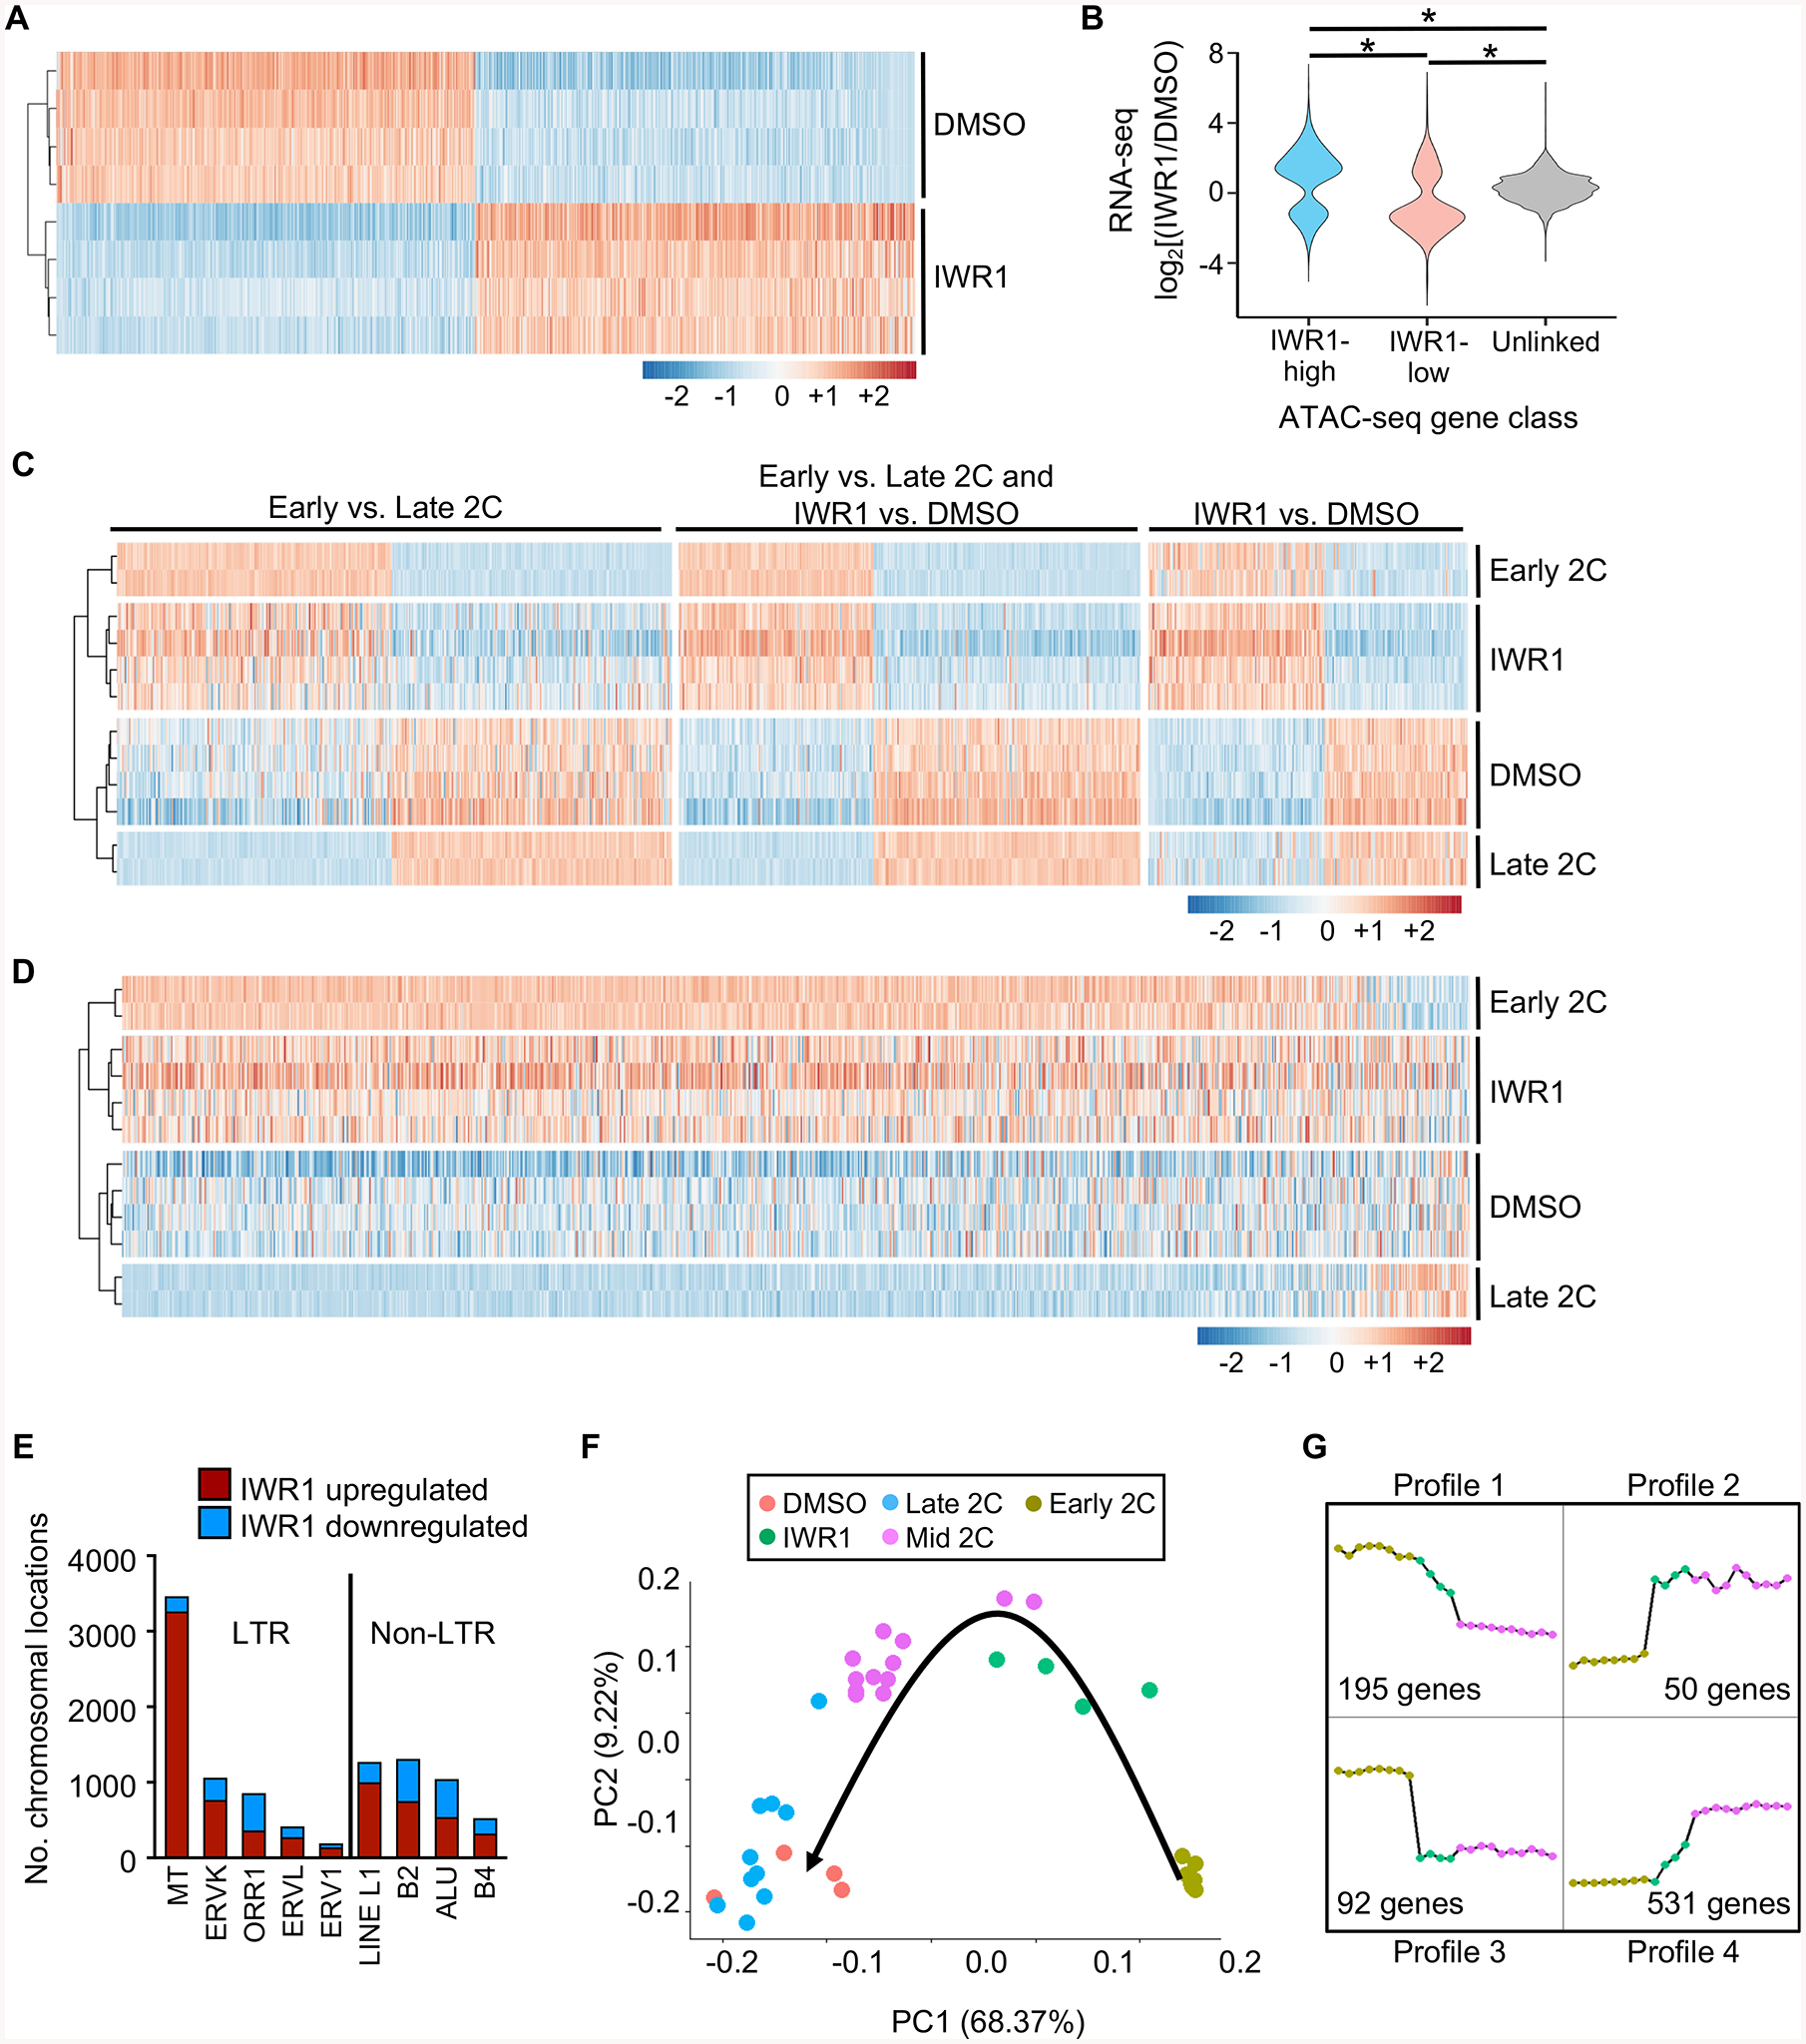
Figure 4. Tankyrase activity is required for EGA to progress to the mid-2C stage.

(A) Differentially expressed (DE) genes sorted by log2fc between DMSO and IWR1, clustered by Euclidean distance. 5697 DE genes; p_adj<0.01 and |log2fc|>1. Z-scores plotted. (B) Violin plot showing correlation between ATAC-seq gene class and RNA-seq gene expression levels. Expression ratio (IWR1/DMSO) of genes within 100 kb of a differential ATAC-seq peak (DESeq2 FDR<0.05) compared to each other and to unlinked genes. *p≤2.2E-16, one-sided Wilcoxon-Mann-Whitney test. (C) Comparison of gene expression differences between earlyand late 2C embryos and IWR1 and DMSO treated embryos. Left set DE (p_adj<0.01, |log2fc|>1) only between early and late 2C embryos. Middle set DE in both early/late and IWR1/DMSO comparisons. Right set DE only between IWR1/DMSO. Early/late 2C data sets from (Wu et al., 2016). Clustered by Euclidean distance prior to conversion to z-scores. Plotted values are z-scores that were computed separately for the two experiments – IWR1/DMSO and early/late 2C. (D) Heatmap of gene expression differences between the early and late 2C embryos and IWR1 and DMSO treated embryos of transcripts degraded ≥8-fold between oocyte and 2C stages (Xue et al., 2013). Genes ordered by log2fc in comparison between early and late 2C data sets. Clustered by Euclidean distance prior to z-score conversion. Plotted values are z-scores, which were computed separately for the two experiments – IWR1/DMSO and early/late. (E) Number of chromosomal regions up- or downregulated for each repetitive element. (F) Principal component analysis of single cell RNA-seq data from mouse embryos in the early, mid, and late 2C stages (Deng et al., 2014) and DMSO/IWR1-treated 2C embryos. Black arrow, progression of time in development. (G) Gene expression profiles generated from RNA-seq datasets from early and mid 2C embryos (Deng et al., 2014), and IWR1-treated 2C embryos. Profiles derived from all genes common to all 3 datasets. Number of genes represents the number present in the set of genes differentially expressed between early and mid 2C embryos that displayed the indicated profile. Graph legend shown in (F).
