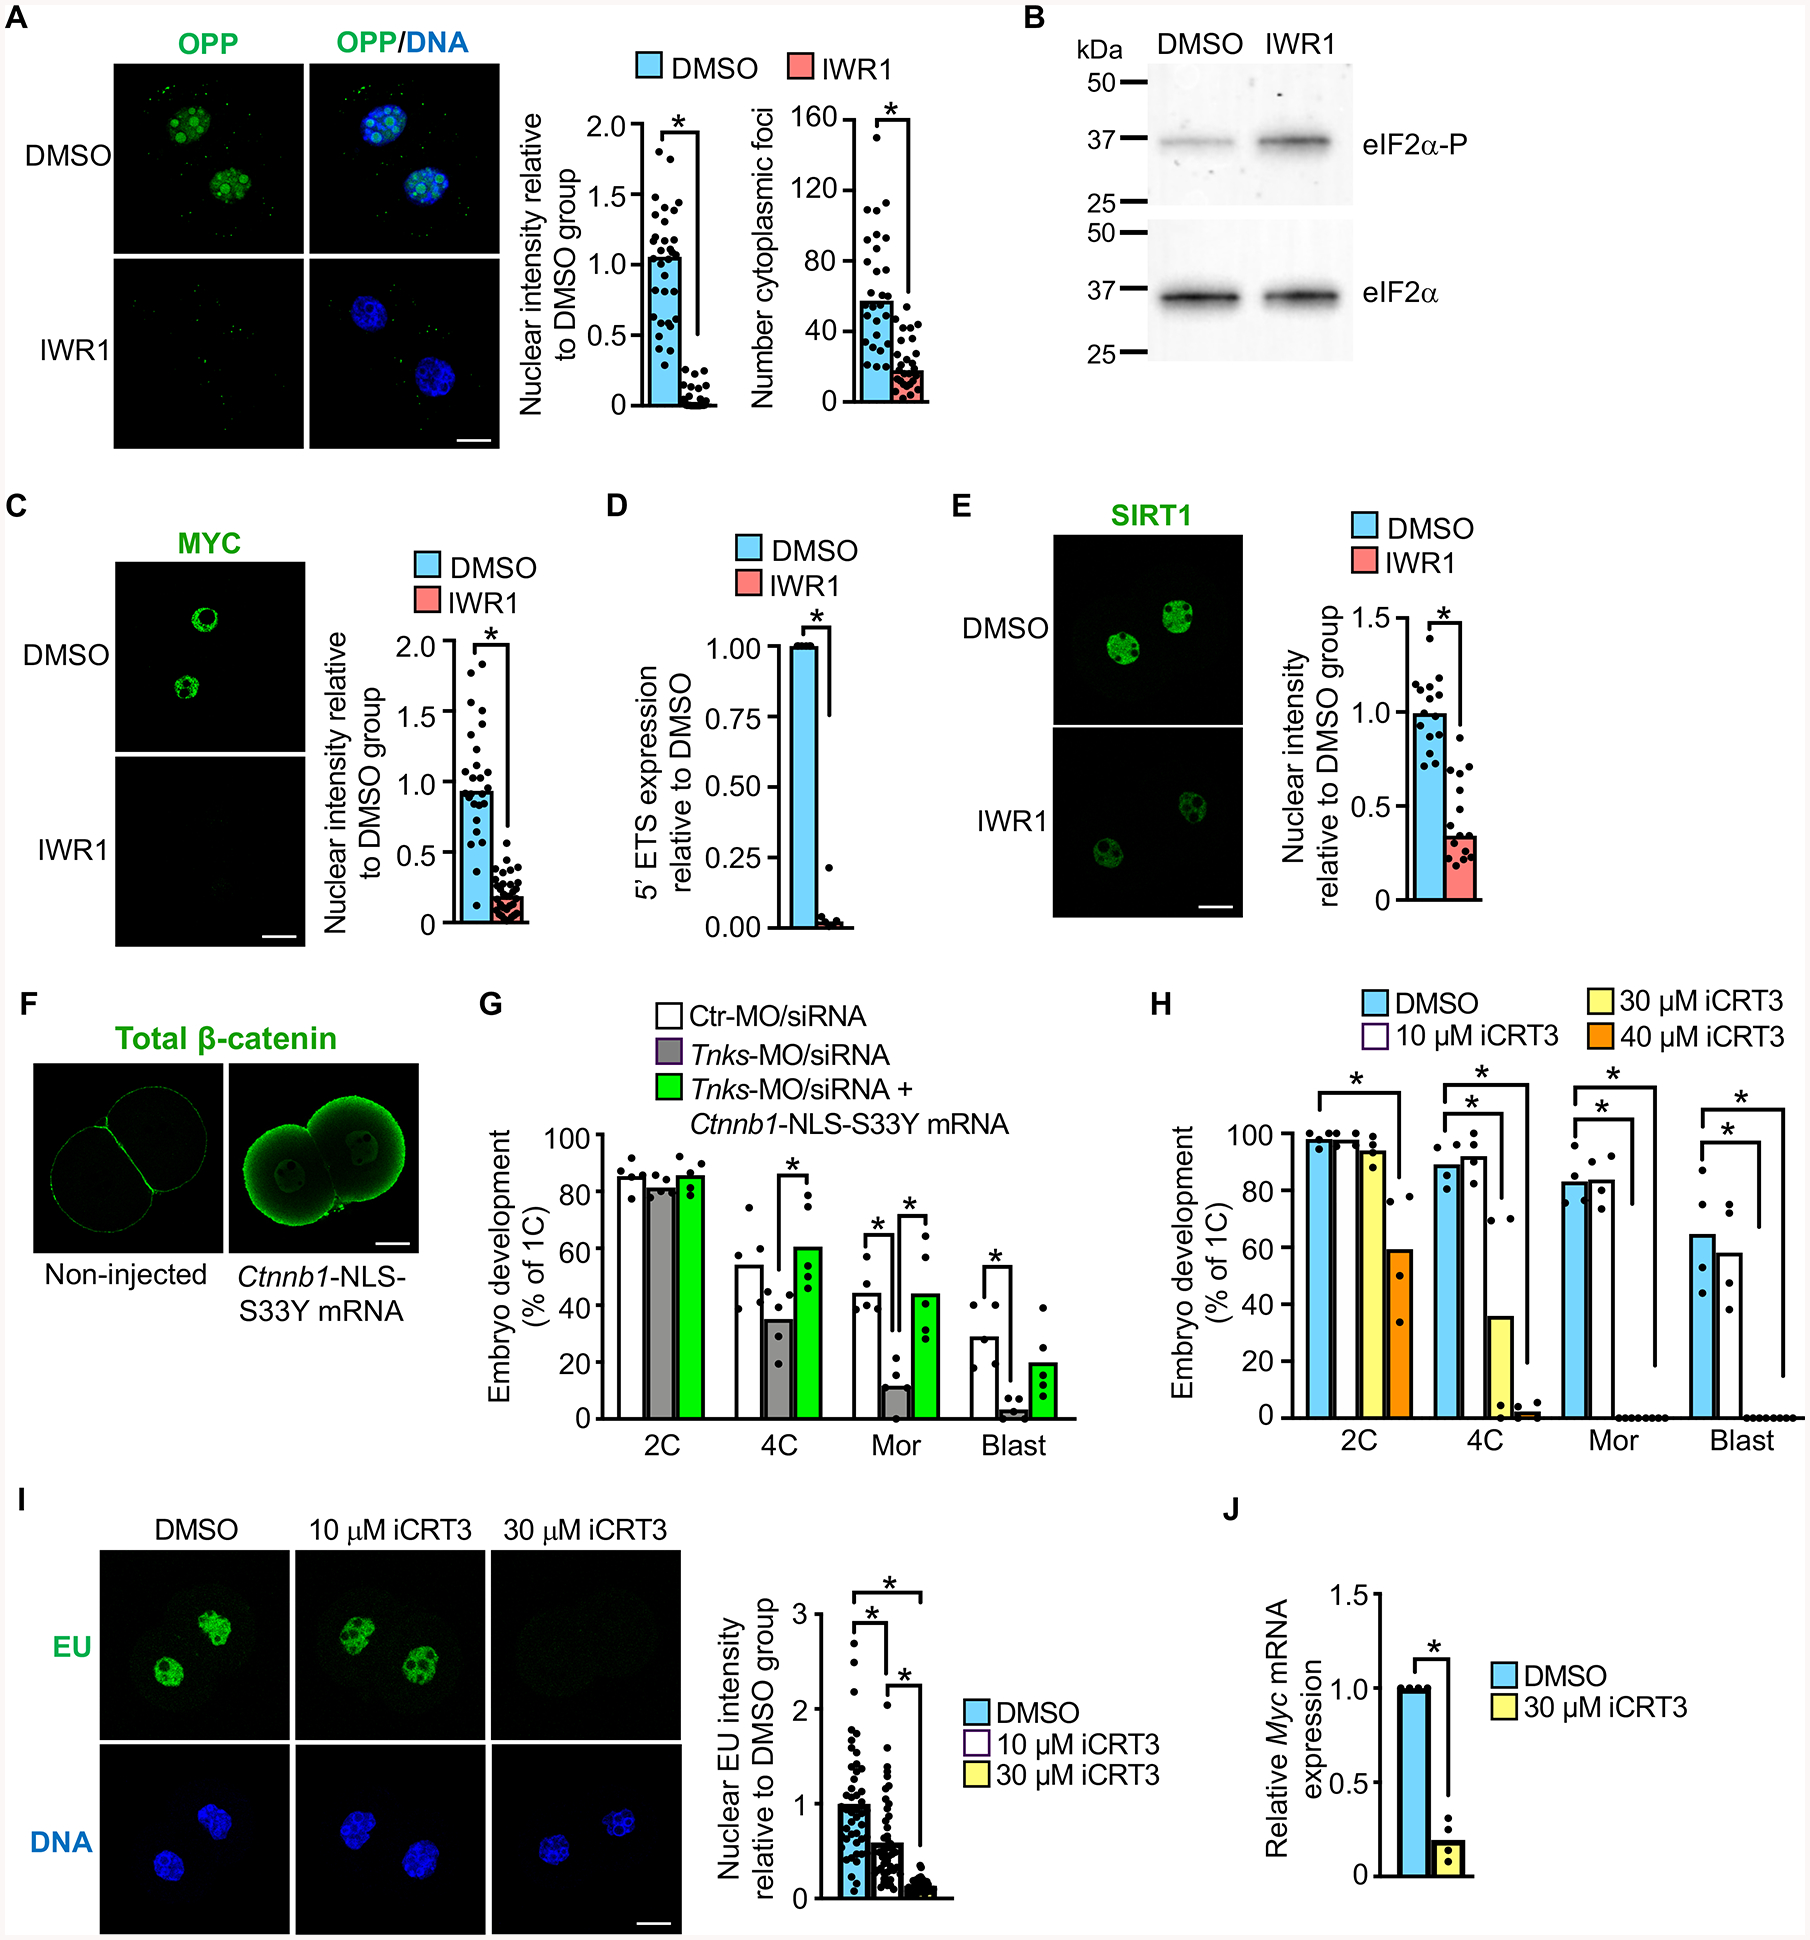
Figure 6. Tankyrase and β-catenin support generation of MYC and global protein translation necessary for embryo development.

(A) OPP staining as indicator of newly translated protein in DMSO or IWR1-treated late 2C embryos. Graphs show nuclear intensity and total number of cytoplasmic foci/group. *p<0.05, t-test; N=3, 28–32 embryos/group. (B) Immunoblot of eIF2α and eIF2α-P in DMSO or IWR1-treated late 2C embryos; 100 embryos/lane. Blot representative of N=3 replicates. (C) MYC immunofluorescence and relative intensity in DMSO or IWR1-treated late 2C embryos. *p<0.05, t-test; N=3, 26–33 embryos/group. (D) Relative expression of 5′ external transcribed spacer (5′ ETS) in DMSO or IWR1-treated late 2C embryos. *p<0.05, Mann-Whitney test; N=6. (E) SIRT1 immunofluorescence and relative intensity in DMSO or IWR1-treated late 2C embryos. *p<0.05, t-test; N=3, 15 embryos/group. (F) Total β-catenin immunofluorescence in late 2C embryos that were either not injected or microinjected at the 1C-stage with Ctnnb1-NLS-S33Y mRNA. (G) Percentage of 1C embryos to reach specified stages following microinjection at the GV-stage with the indicated MO/siRNA ± mRNA. N=5, 19–47 1C embryos/group/replicate; *p<0.05, ANOVA with Dunnett’s. (H) Percentage of 1C embryos to reach specified stages following culture with DMSO or iCRT3. N=4; 21–44 1C embryos/group/; *p<0.05, Kruskal-Wallis with Dunn’s. (I) EU staining and quantification in 2C embryos cultured in DMSO or iCRT3. Upper panels, EU; lower panels, DNA. N=3, 46–47 embryos/group; *p<0.05, Kruskal-Wallis with Dunn’s. (J) Relative Myc expression in 2C embryos cultured in DMSO or iCRT3. N=4, *p<0.05, Kruskal Wallis with Dunn’s. Median or mean, as appropriate, and all values shown in graphs.
See also Figures S5 and S6.
