Fig. 1.
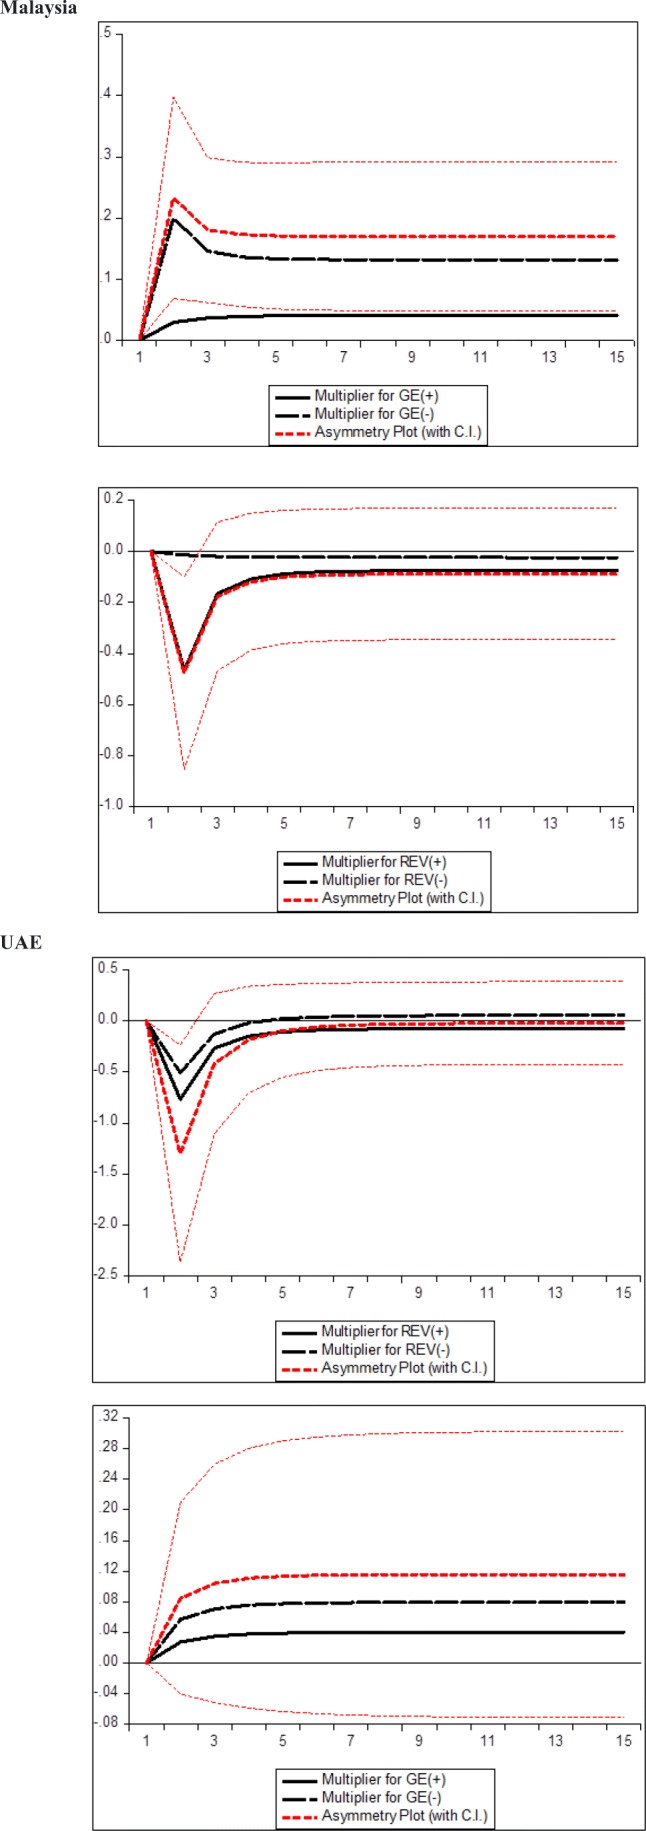
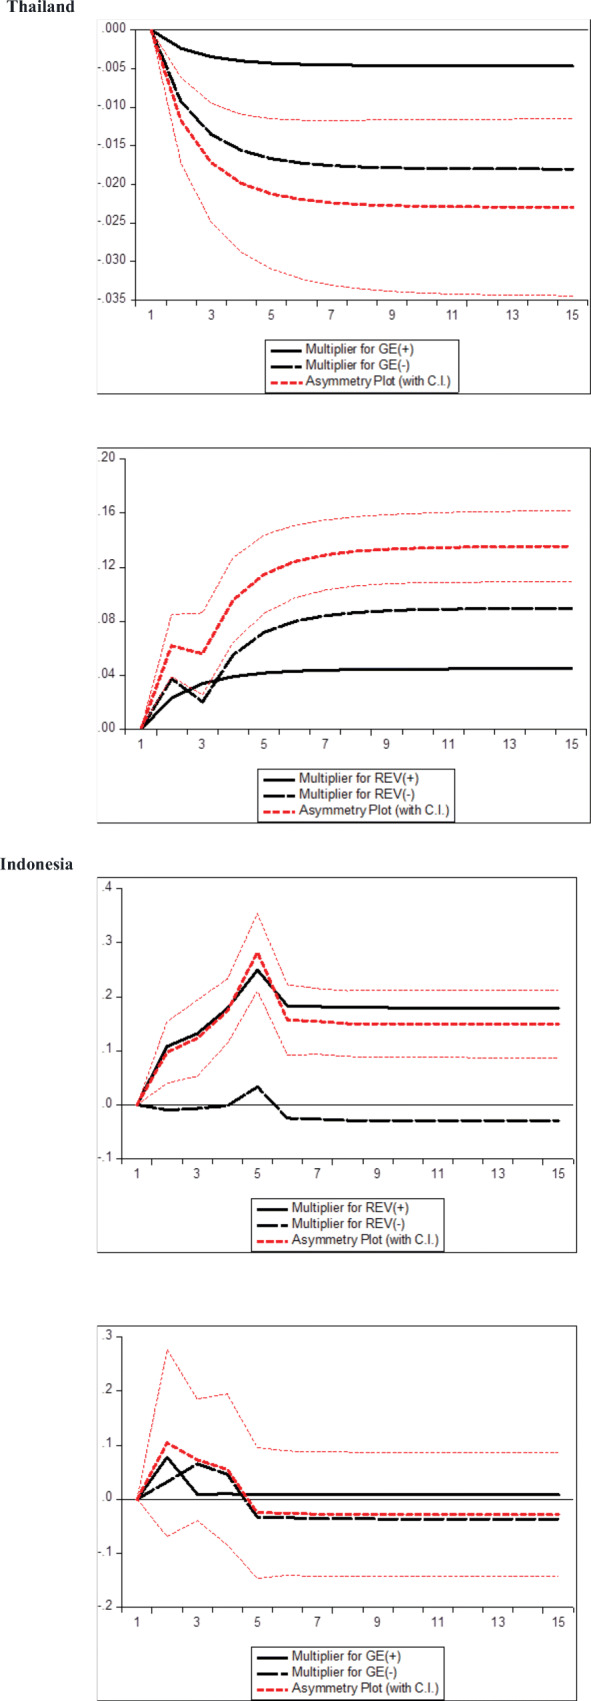
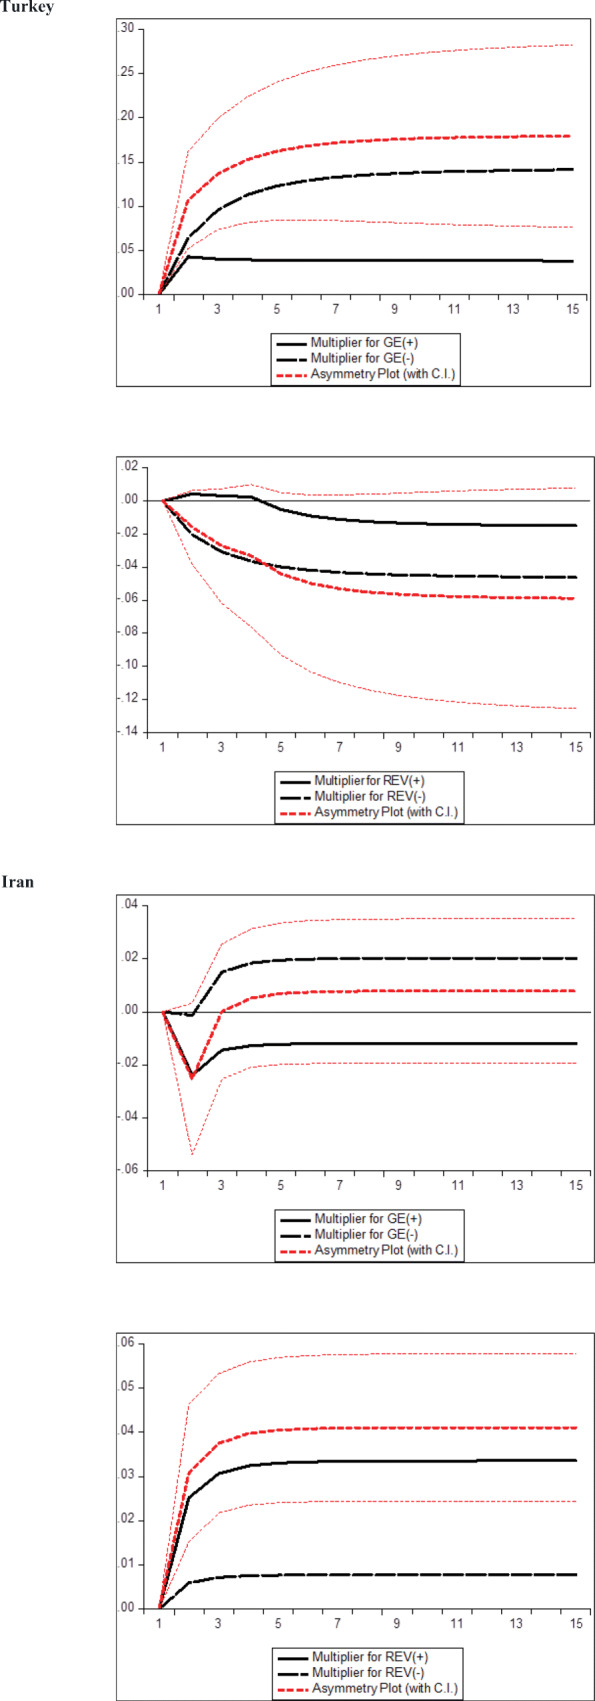
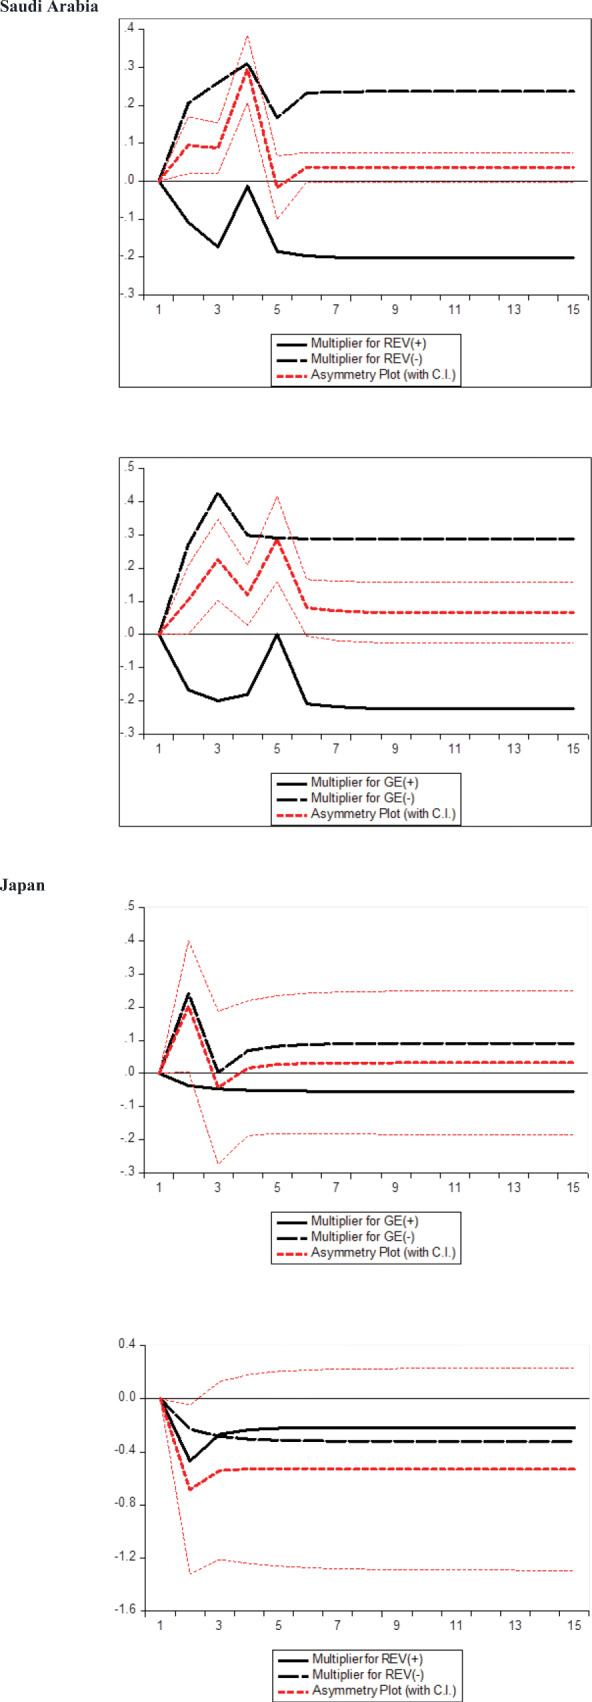
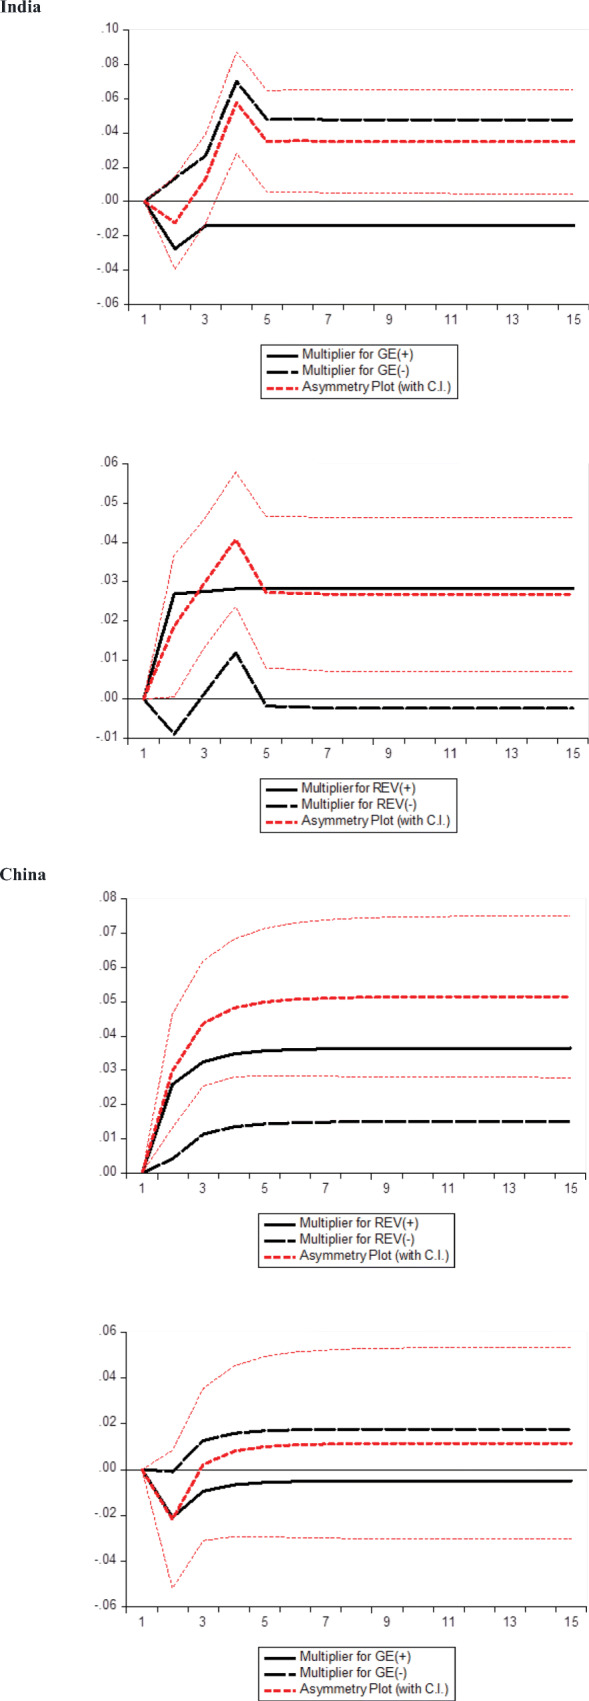
Dynamic multiplier graphs of Asian economies. GE is government expenditure and REV is government revenues. Years are plotted on the horizontal axis and the magnitude shocks (+ and −) on the vertical axis


Dynamic multiplier graphs of Asian economies. GE is government expenditure and REV is government revenues. Years are plotted on the horizontal axis and the magnitude shocks (+ and −) on the vertical axis