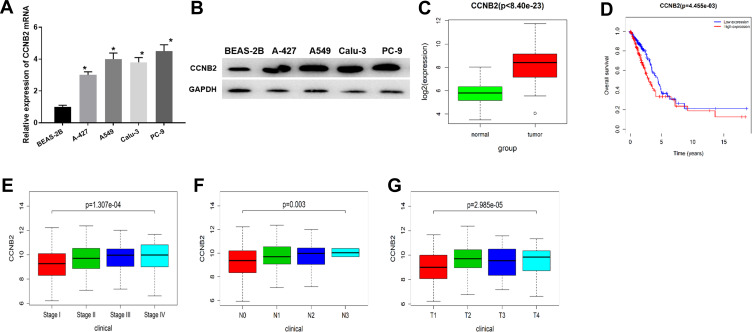
Figure 1.
The expression and prognosis of CCNB2 in LUAD. (A and B) mRNA and protein expressions of CCNB2 in BEAS-2B and LUAD cell lines (A-427, A549, Calu-3, PC-9); (C) The expression of CCNB2 was low in normal samples (green) and high in tumor samples (red); (D) Survival curves of CCNB2 expression for prognosis in the TCGA-LUAD dataset. Red indicates high expression group and blue indicates low expression group; (E–G) Box plots of CCNB2 expression in different clinical stages, N stages and T stages of LUAD.
Note: *Indicates P<0.05.

