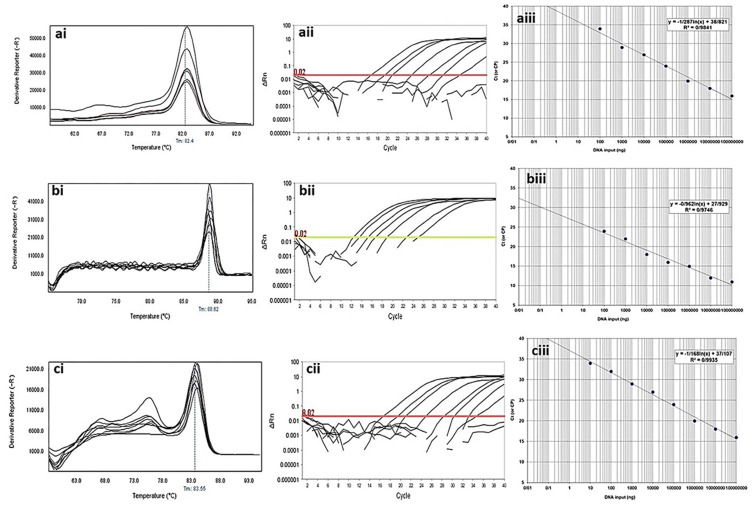
Figure 5.
Analytical sensitivity of real-time PCR for primers used to detect class A β-lactamases genes in clinical isolates of P. aeruginosa. ai to aiii: blaTEM gene; ai: Melting curve in 82.4°C; aii: Amplification curve; and aiii: Standard curve with efficiency=1.429. bi to biii: blaSHV gene; bi: Melting curve in 88.52°C; bii: Amplification curve; and biii: Standard curve with efficiency=1.742. ci to ciii: blaKPC gene; ci: Melting curve in 83.55°C; cii: Amplification curve; and ciii: Standard curve with efficiency=1.575. The mean of a: 108; b: 107; c: 106; d: 105; e: 104; f: 103; g: 102; h: 101 and i: 10° CFU/mL of DNA dilutions. Horizontal lines represent cycle threshold of Real-time PCR. One peak with a shoulder corresponds to genomic DNA amplification; no peak corresponds to no amplification. SYBR Green I Dye and single-tube reaction were used in this test. Also, Real-Time PCR was performed as single-step.

