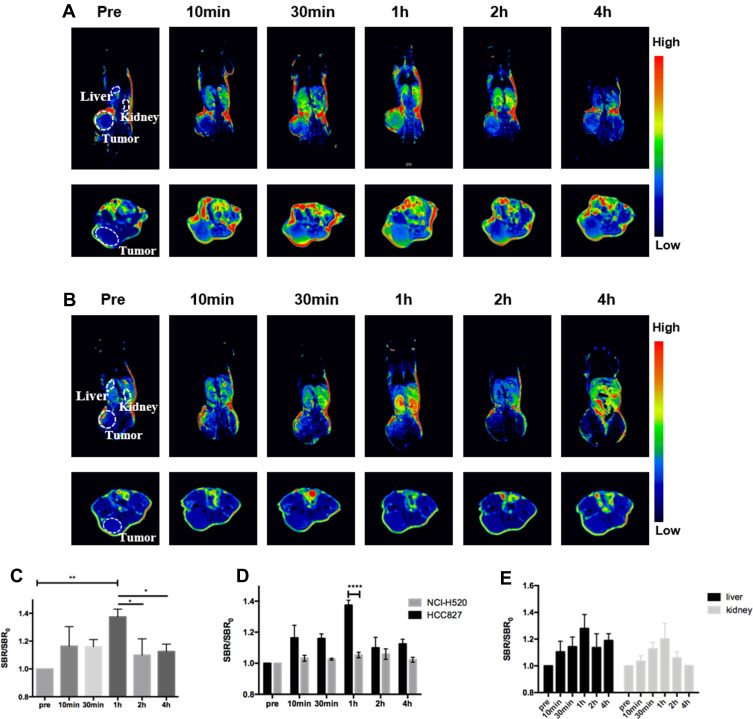
Figure 5.
In vivo MR imaging in animal models injected with Gd@C-dots-Cys-ZEGFR:1907. (A) Representative MR images of HCC827 tumors at different times. (B) Representative MR images of NCI-H520 tumors at different times. (C) Quantitative analysis of MR images in HCC827, SBR= SI(tumor)/SI(muscle), (*P<0.05, ** P<0.01). (D) Quantitative analysis of MR images between HCC827 and H520 tumor in 1 hour (****P<0.0001). (E) Quantitative analysis of MR images between liver and kidney signal intensity at different times. SBR= SI(organ)/SI(muscle).

