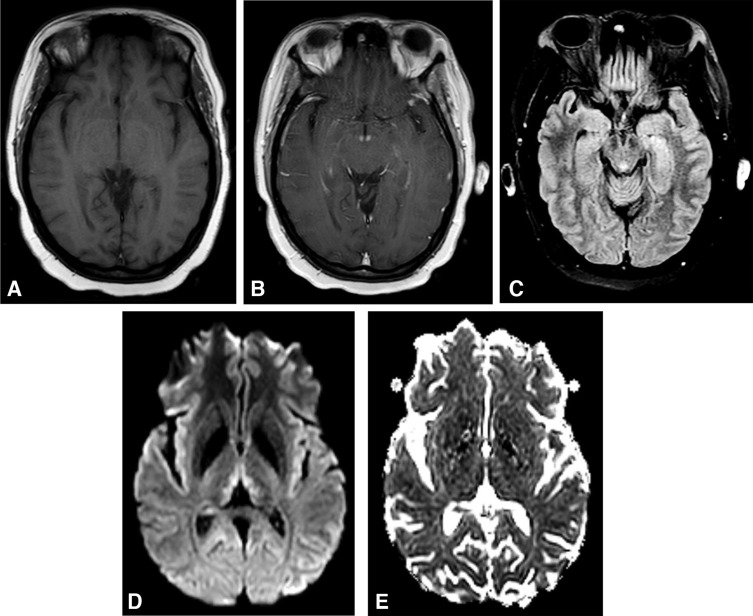
Figure 3.
Brain MRI findings in Wernicke encephalopathy. Axial views. (A) Precontrast T1 scan is unremarkable. (B) Postcontrast T1 scan demonstrates enhancement of the mammillary bodies. (C) T2 FLAIR image reveals hyperintensity of the periaqueductal gray. (D) Diffusion-weighted imaging shows hyperintense signal in the medial thalami. (E) ADC map shows mild diffusion restriction, consistent with cytotoxic edema.

