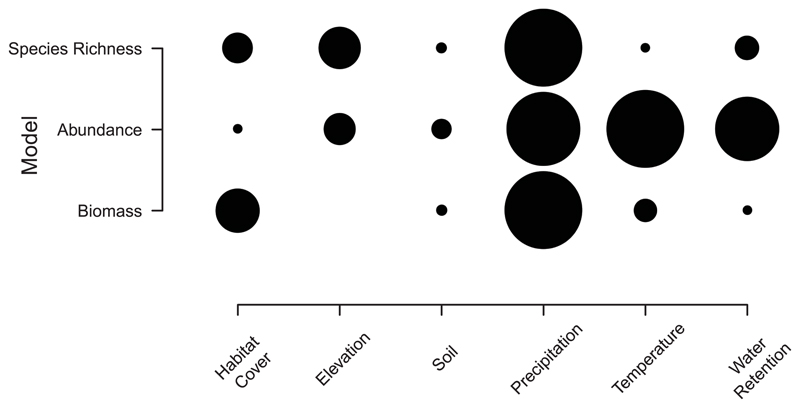
Fig. 3. The importance of the six variable themes from the three biodiversity models.
Rows show the results of each model (top, species richness; middle, abundance; bottom, biomass). Columns represent the variable themes that are present in the simplified biodiversity model. The most important variable group has the largest circle. Within each row, the circle size of the other variable themes is proportional to the relative change in importance. The circle size should only be compared within a row.

