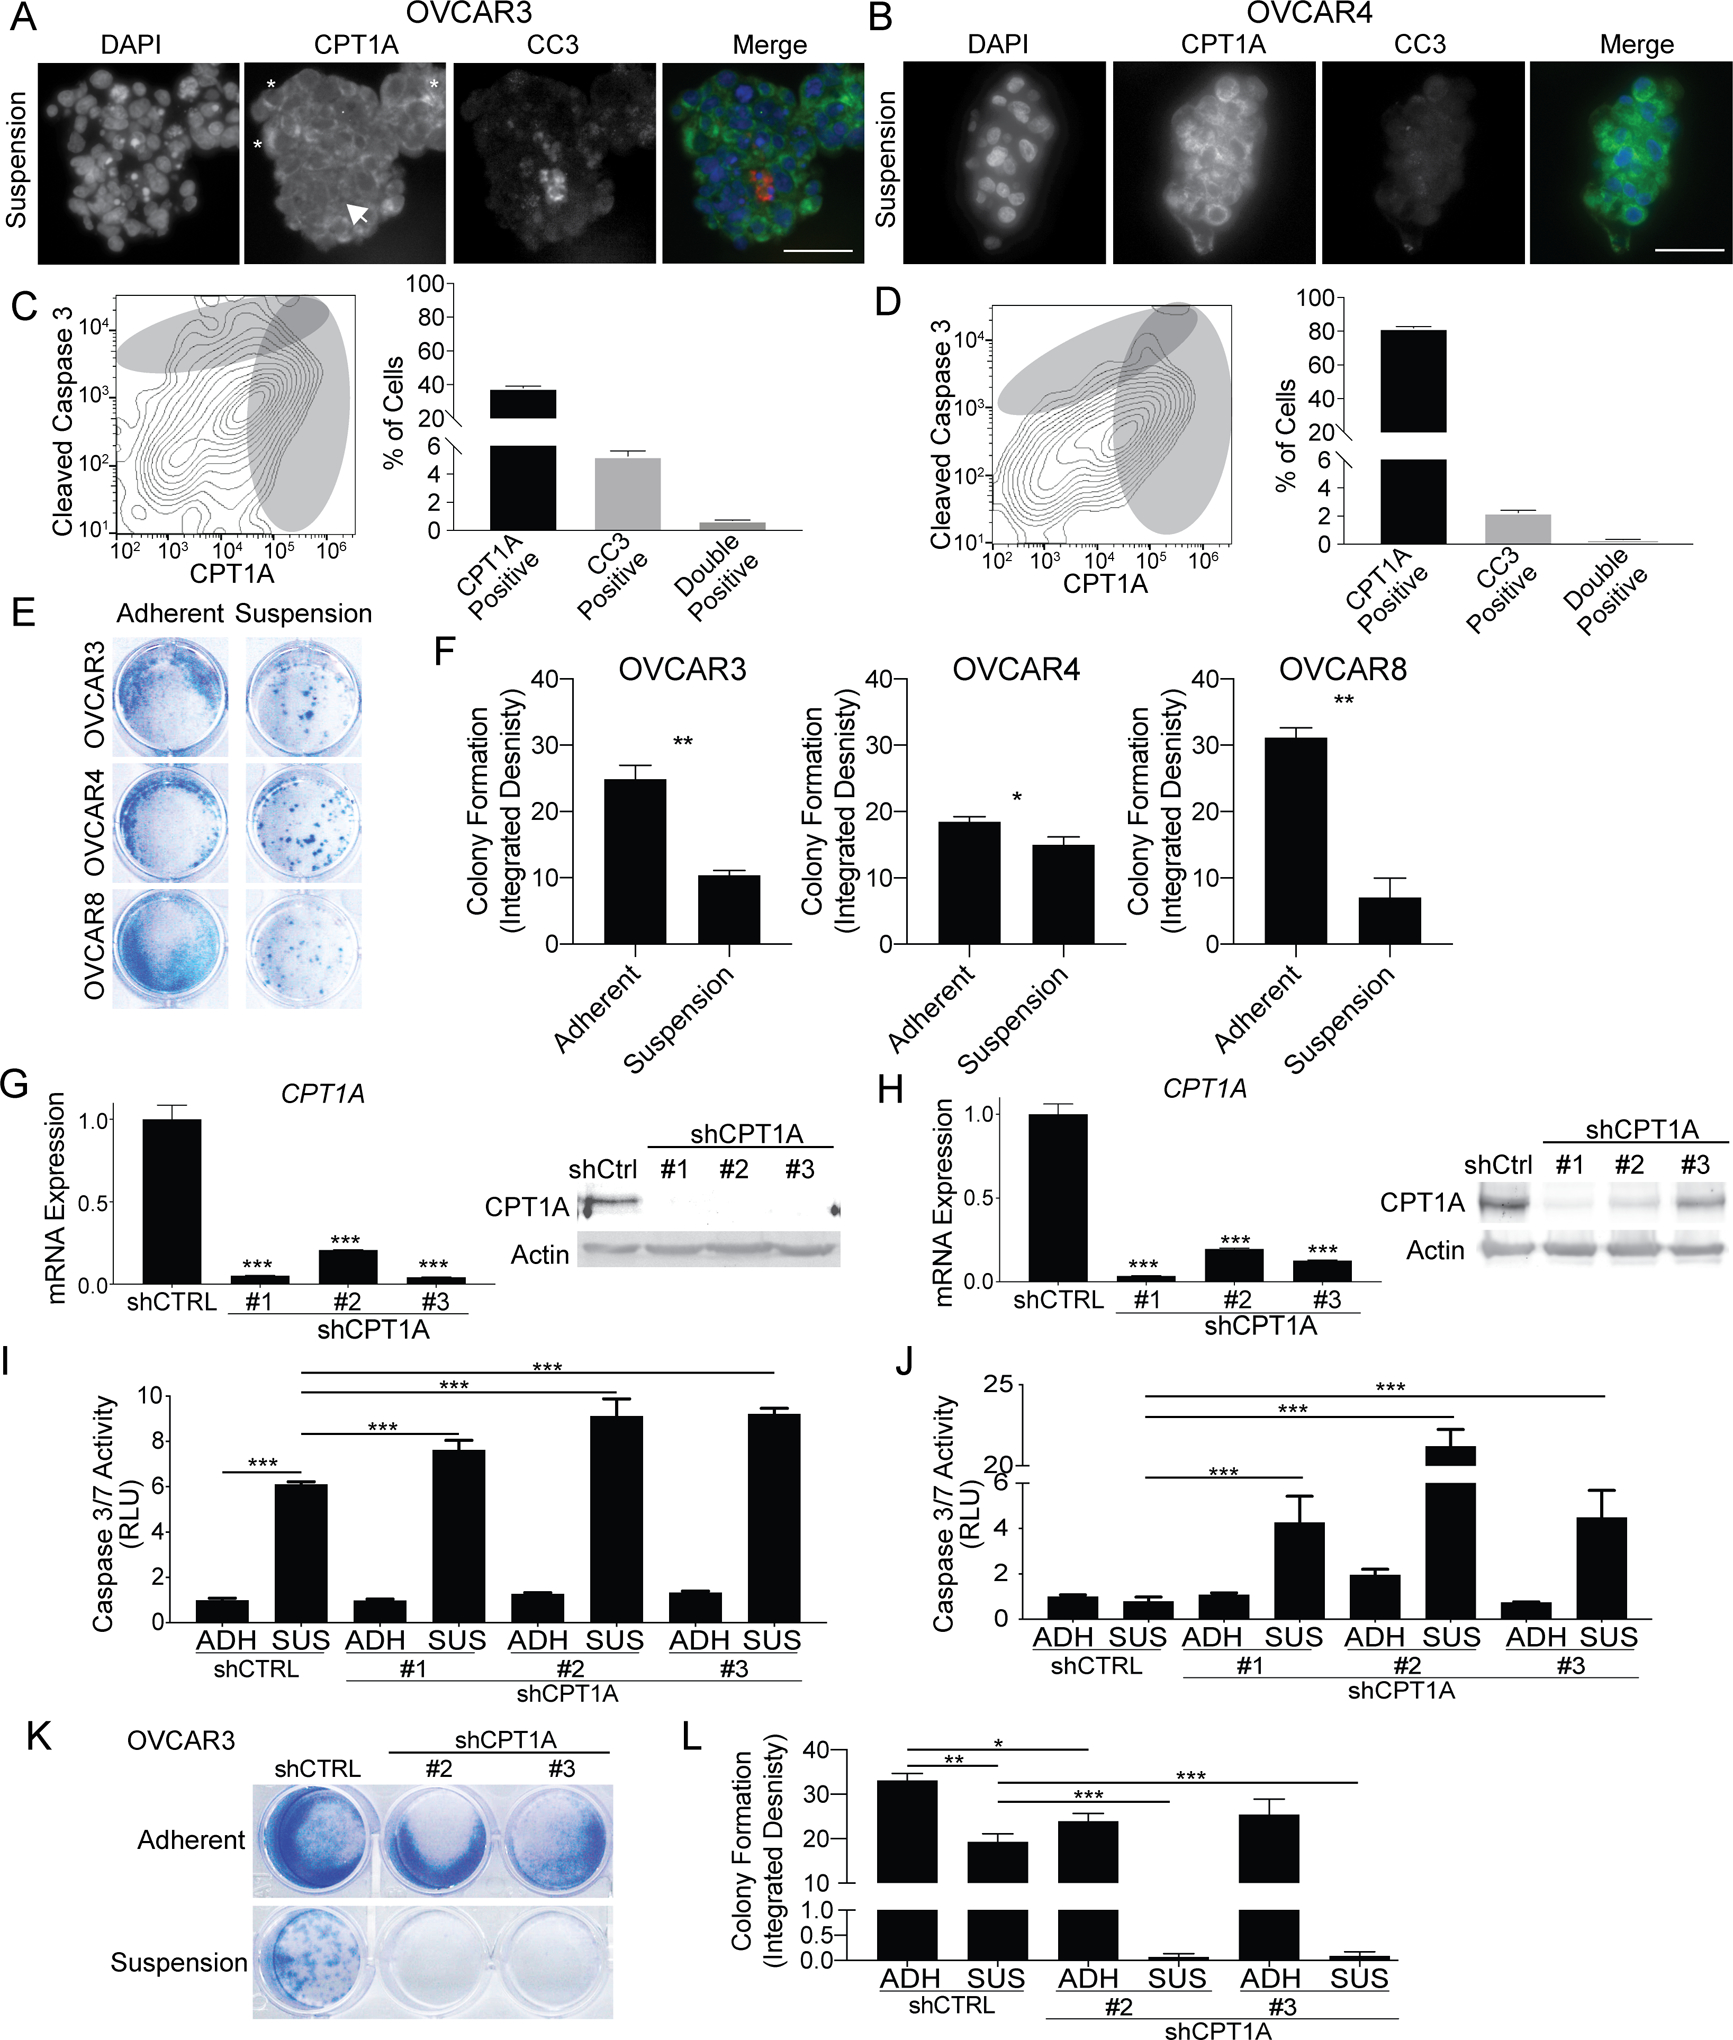
Figure 2. CPT1A upregulation in suspension cells protects against anoikis.

A) OVCAR3 cells cultured in suspension for 48 h were embedded in histogel and utilized for immunofluorescence against CPT1A (green) and cleaved caspase 3 (CC3, red). White arrow = low CPT1A and high CC3 Asterisk = high CPT1A cell. Scale bar = 50 microns. B) Same as A, but with OVCAR4 cells. C) OVCAR3 cells cultured in suspension for 48 h fixed and stained for CPT1A-488 and CC3–700. Cells analyzed via flow cytometry. The frequency of CPT1A and CC3 positive cells (gray circles) were calculated. D) Same as C, but with OVCAR4 cells. E) OVCAR3, OVCAR4, and OVCAR8 cells cultured in suspension for 48 h and were plated in adherent condition. After 24 h, cells were fixed and used for a crystal violet colony formation assay. F) The integrated density of crystal violet measured. G) OVCAR3 cells were transduced with shControl (shCtrl) and three independent shCPT1A (#1–3) constructs. CPT1A knockdown confirmed via RT-qPCR and immunoblot. H) Same as E, but with OVCAR4 cells. I) OVCAR3 shCtrl and shCPT1A cells were cultured in adherent (ADH) or suspension (SUS) for 48 h. Caspase 3/7 activities were measured via CaspaseGlo assay. J) Same as G, but with OVCAR4 cells. K) OVCAR3 shCtrl and shCPT1A cultured in adherent (ADH) or suspension (SUS) for 48 h, plated into adherent conditions, and incubated for 5 days. Cells were stained with crystal violet. L) Same as K, integrated density measured (ImageJ). Error bars = S.E.M. Statistical analysis = ANOVA. *p<0.05, **p<0.01, ***p<0.001.
