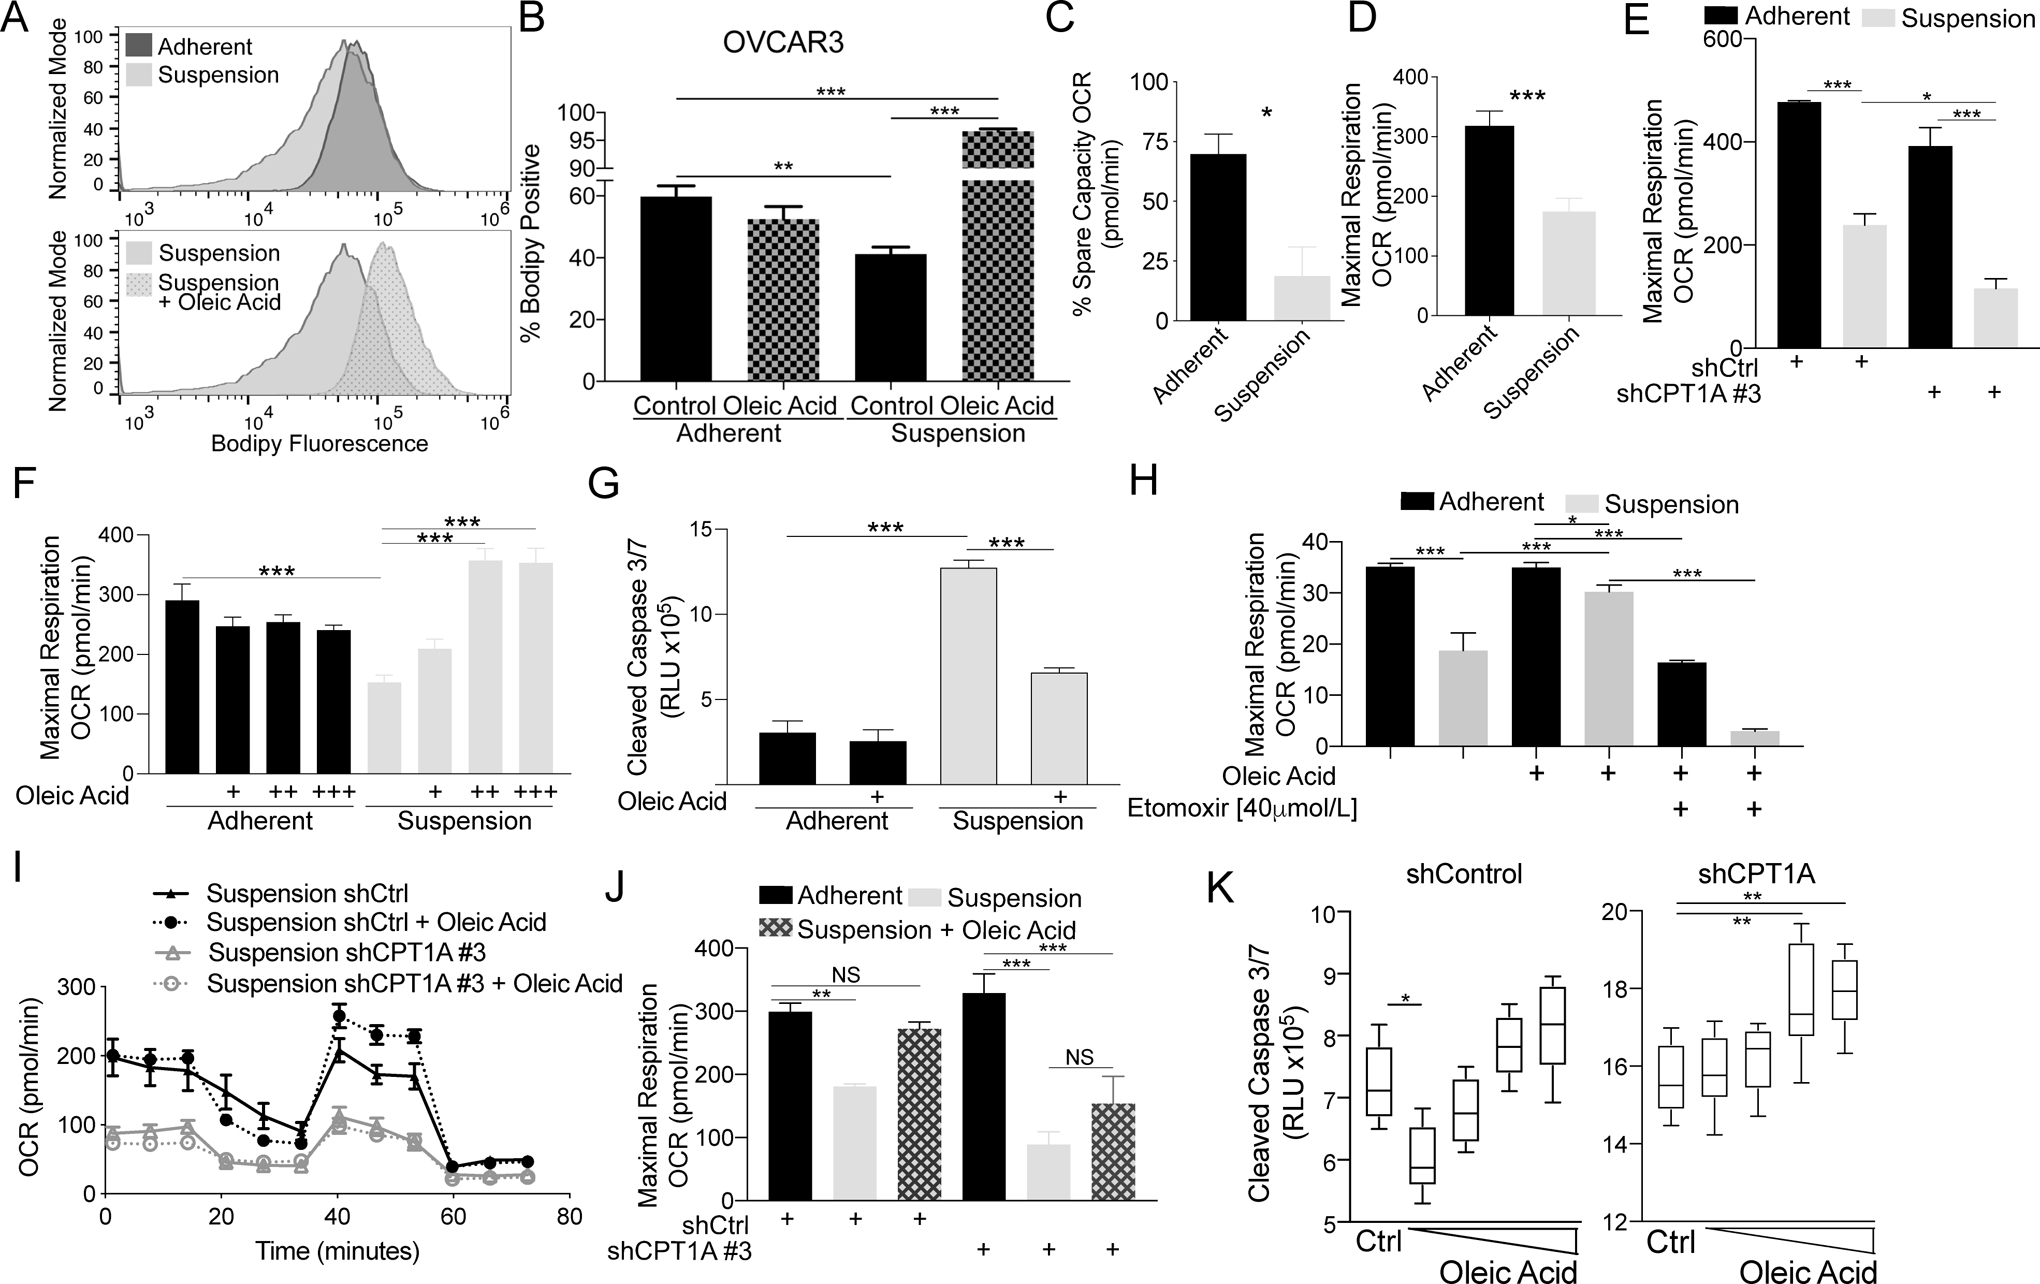
Figure 3. HGSOC cells in forced-suspension demonstrate a dependency of FA metabolism to promote anoikis resistance.

A) OVCAR3 cells cultured with or without BSA-conjugated oleic acid in adherent or suspension for 48 h were incubated with fluorescent bodipy, and cells were analyzed via flow cytometry. B) Quantification of bodipy positive cells. C) OVCAR3 cells cultured in adherent and suspension for 48 h were utilized for mitochondrial stress test analysis with an Agilent Seahorse XF96 Analyzer. Percentage of spare capacity oxygen consumption rate (OCR) calculated with the Wave program. D) Same as C, but examined maximal respiration. E) OVCAR3 shCtrl and shCPT1A #3 cells were cultured in adherent and suspension for 48 h and utilized for mitochondrial stress test analysis with an Agilent Seahorse XF96 Analyzer. Maximal respiration is graphed. F) OVCAR3 cells cultured in adherent and suspension for 48 h with increasing doses of oleic acid (+ 5, ++ 25, and +++ 50 μmol/L). Maximal respiration was measured. G) OVCAR3 cells were cultured in adherent or suspension for 48 h with oleic acid. Caspase 3/7 activities were measured via CaspaseGlo. H) OVCAR3 cells cultured in adherent and suspension for 48 h. The mitochondrial stress test analysis was performed with oleic acid and/or etomoxir. Maximal respiration was measured. I) OCR measured in OVCAR3 shControl (shCtrl) and shCPT1A with oleic acid (25 μmol/L). J) Maximal respiration of OVCAR3 shControl and shCPT1A cultured in adherent and suspension-cultured supplemented with or without oleic acid. K) Caspase 3/7 activities measured in OVCAR3 shControl (shCtrl) and shCPT1A with increasing concentrations of oleic acid (5 – 100 μmol/L). Error bars = S.E.M. Statistical analysis = ANOVA. *p<0.05, **p<0.01, ***p<0.001.
