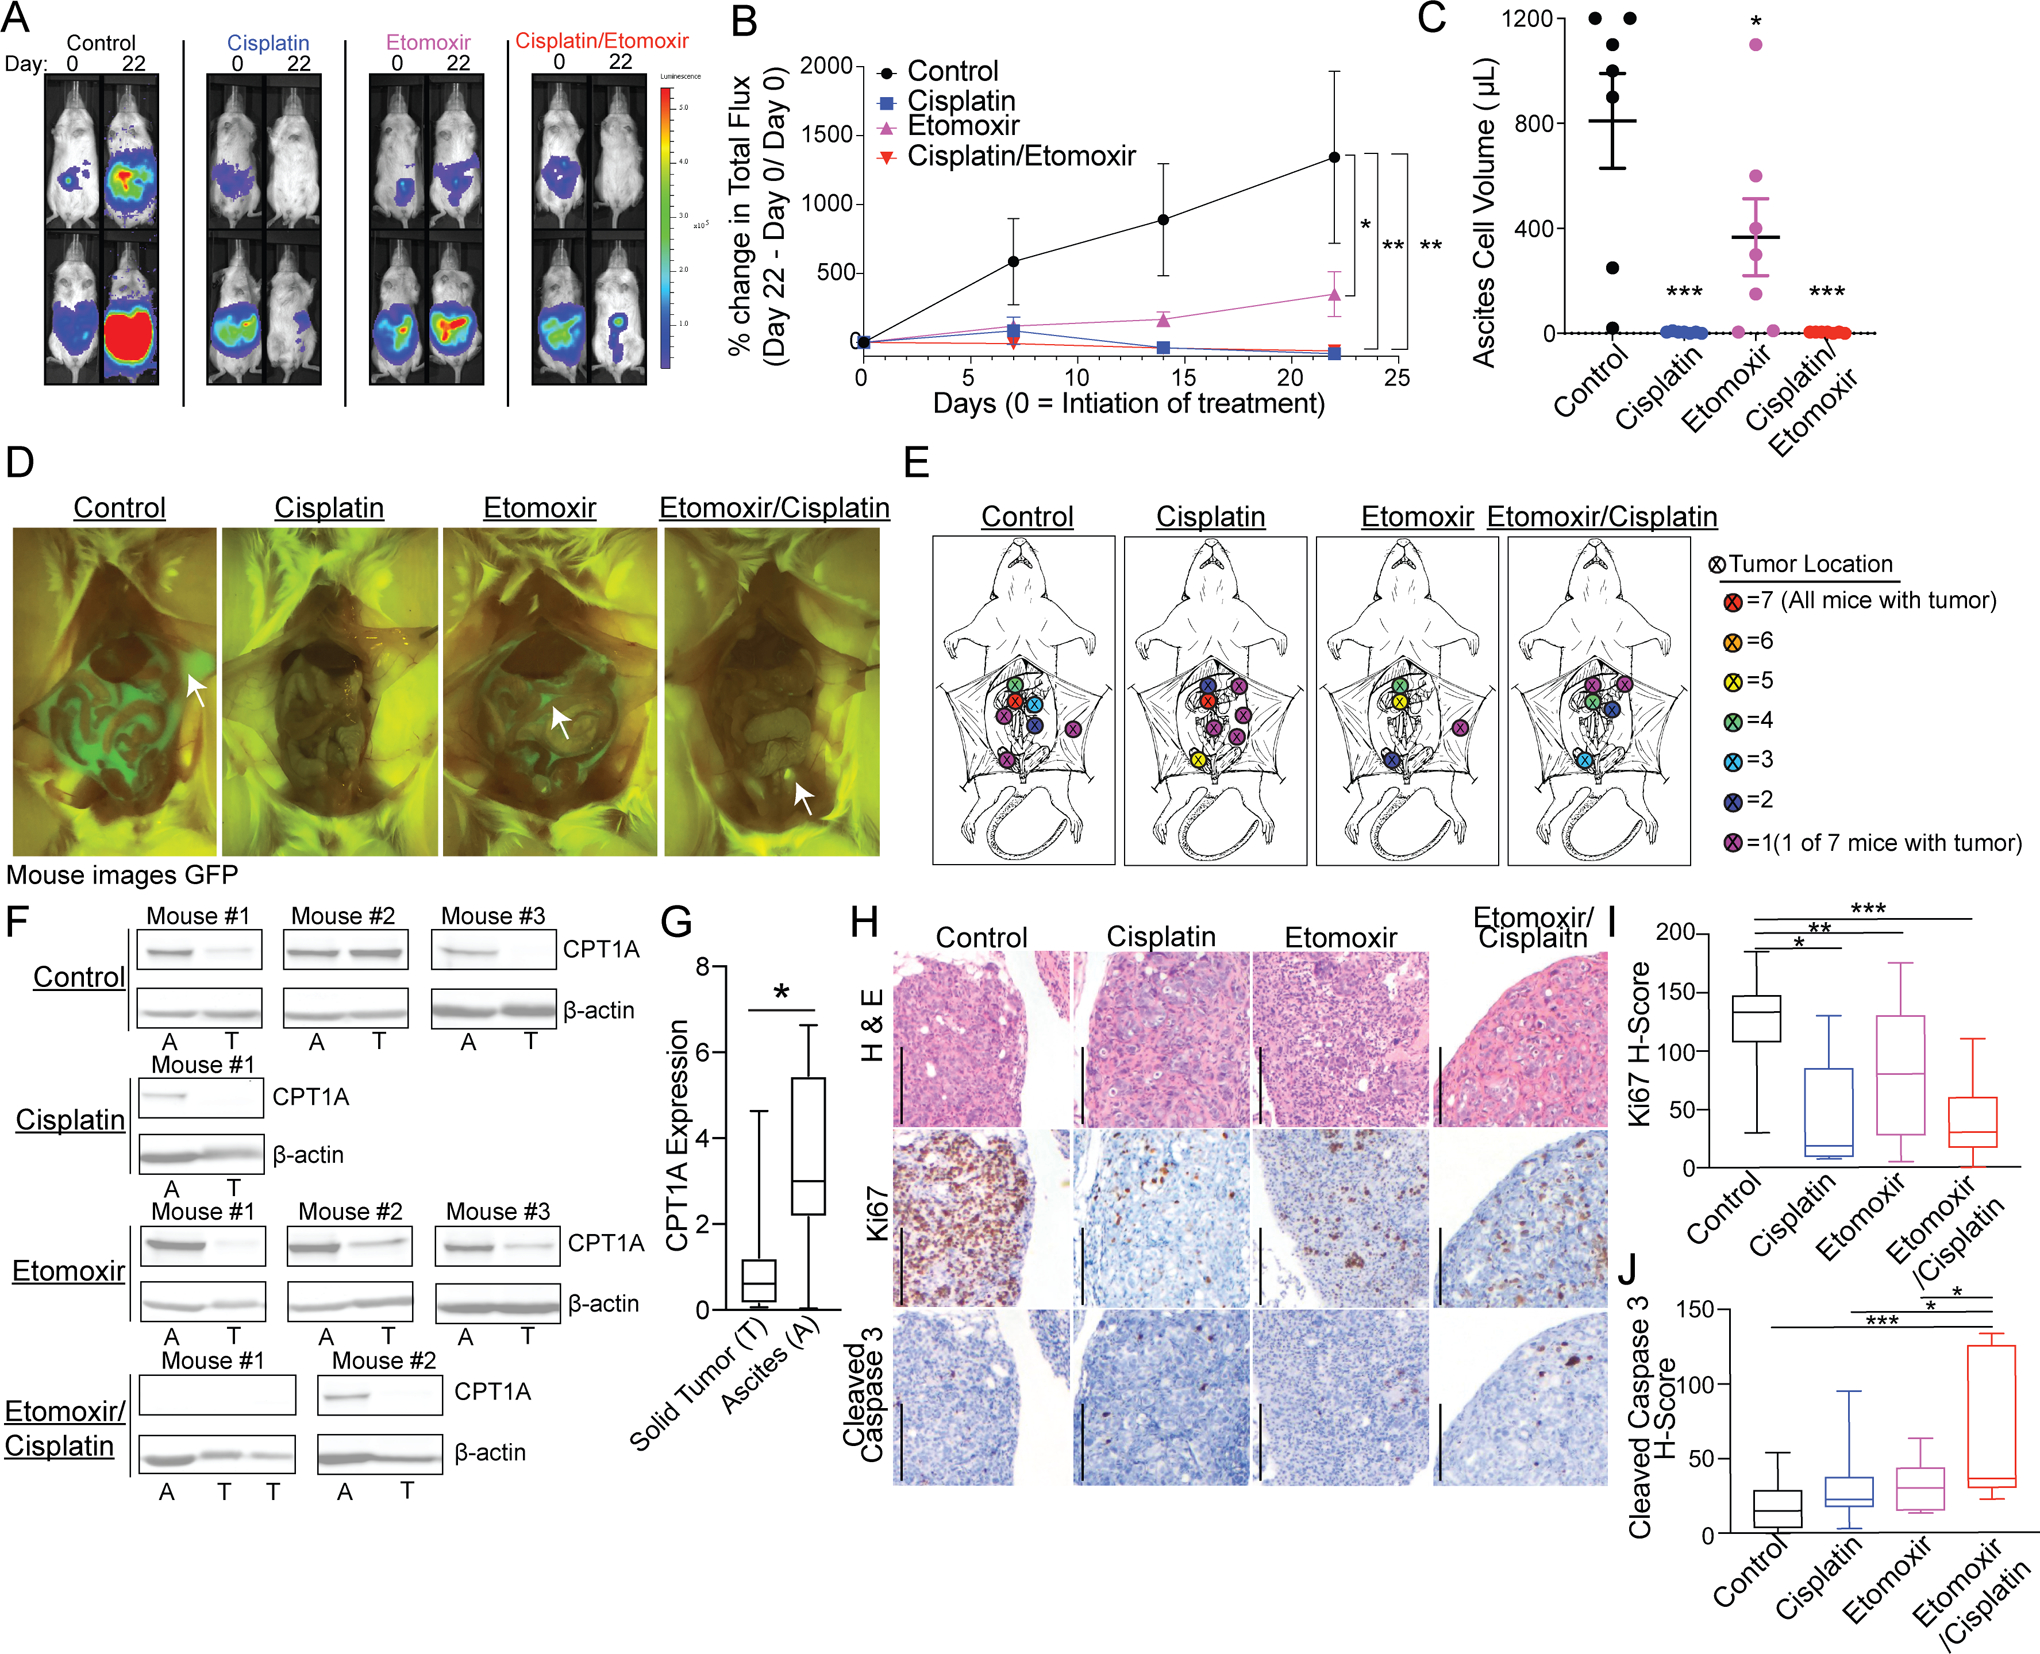
Figure 4. Inhibition of CPT1A inhibits tumor progression.

A) PDX-GTFB1016 cells tagged with GFP/luciferase were implanted in NSG mice. Tumor-bearing mice were treated for 21 days with vehicle control (n=7), cisplatin (n=7), etomoxir (n=7), or cisplatin/etomoxir combination (n=7). Representative luminescence images of mice at day 0 of treatment and after cessation of treatment, day 22. B) Percent change in total flux over the course of treatment. C) The volume of ascites-associated tumor cells on day 22. D) Representative images of GFP signal on day 22. E) Compilation of tumor dissemination in all of the groups. Color represents the absolute number of tumors observed at the indicated location. F) Expression of CPT1A in ascites-associated tumor cells (A) versus matched solid tumors (T). G) Same as F, densitometric analysis of CPT1A expression. H) Immunohistochemistry of H&E, Ki67, and cleaved caspase 3. Scale bar = 200 microns. I) Histological score of Ki67 expression blindly calculated based on the percentage and intensity of the positive stain. J) Histological score of cleaved caspase 3 expression blindly calculated based on the percentage and intensity of the positive stain. Error bars = S.E.M. Statistical analysis = ANOVA. *p<0.05, **p<0.01, ***p<0.001.
