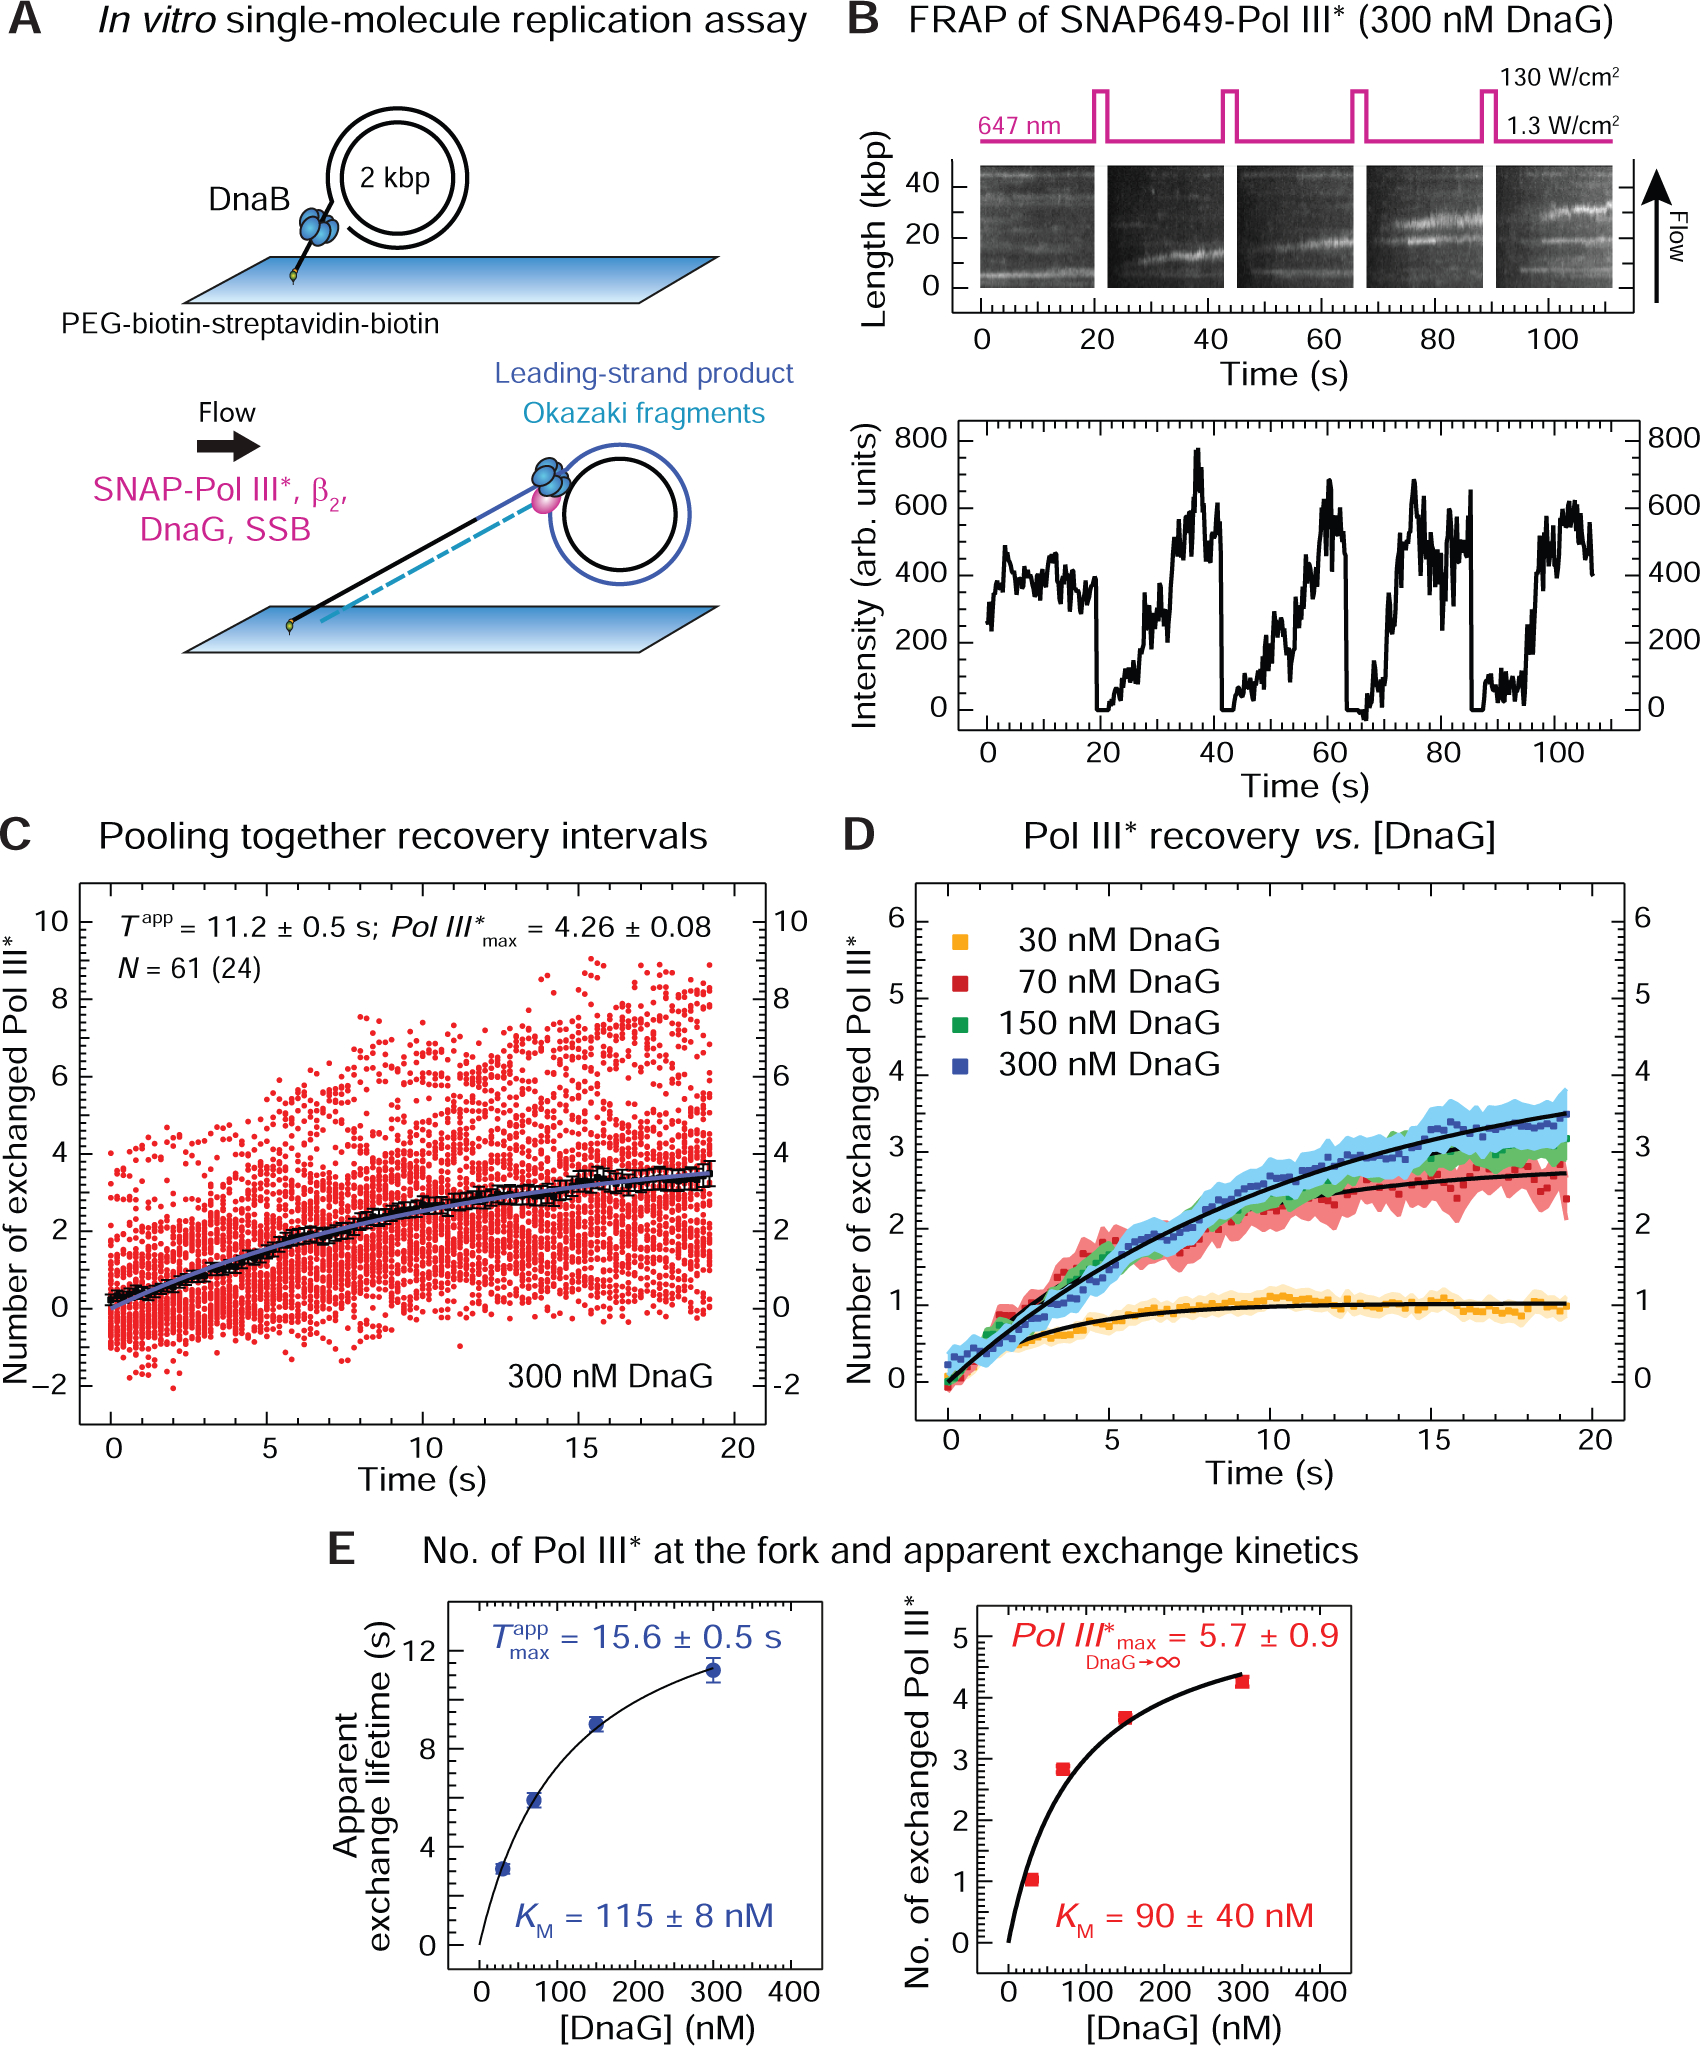
Figure 6. DnaG Stimulates Polymerase Accumulation and Slows Its Exchange at the Replication Fork.

(A) Two stages of the single-molecule leading- and lagging-strand rolling-circle DNA synthesis assay. First, the rolling-circle substrate with DnaB is loaded with its 5’-tail bound to a coverslip. Then SNAP-Pol III* (3 nM), β2 (40 nM), SSB (250 nM) and DnaG (30–300 nM, as indicated) are introduced to initiate replication.
(B) Top: representative kymograph of SNAP-Pol III* at the fork in the presence of DnaG. Every 20 s, a 2-s high-power laser pulse photobleaches SNAP-Pol III* in the field of view. Bottom: recovery of SNAP-Pol III* intensities over time as unbleached polymerases from solution bind to an individual active replisome.
(C) Intensities (red circles) obtained from 61 recovery-interval trajectories of 24 replisomes are converted into the number of exchanged Pol III* and displayed, together with their average values (black squares). Fitting the evolution of average recovery intensities in time with the FRAP recovery equation (Equation 3, Method Details) provides the apparent exchange time Tapp, the maximum number of exchanged Pol III* (Pol III*max), and the remaining background intensity y0, converted to number of Pol III* (y0 = 0.72 ± 0.04), was then subtracted from every other curve.
(D) Averaged recovery intensities at each [DnaG] and their FRAP recovery fit curves (black). The corresponding values for Tapp, Pol III*max, and y0 are presented in Figure S4.
(E) Tapp (left) and Pol III*max (right), plotted as a function of [DnaG], fit with a steady-state equation (Equation 4, Method Details), providing indicated values of KM and the maximum number of exchanged Pol III* as [DnaG] approaches infinity.
See also Figure S4.
