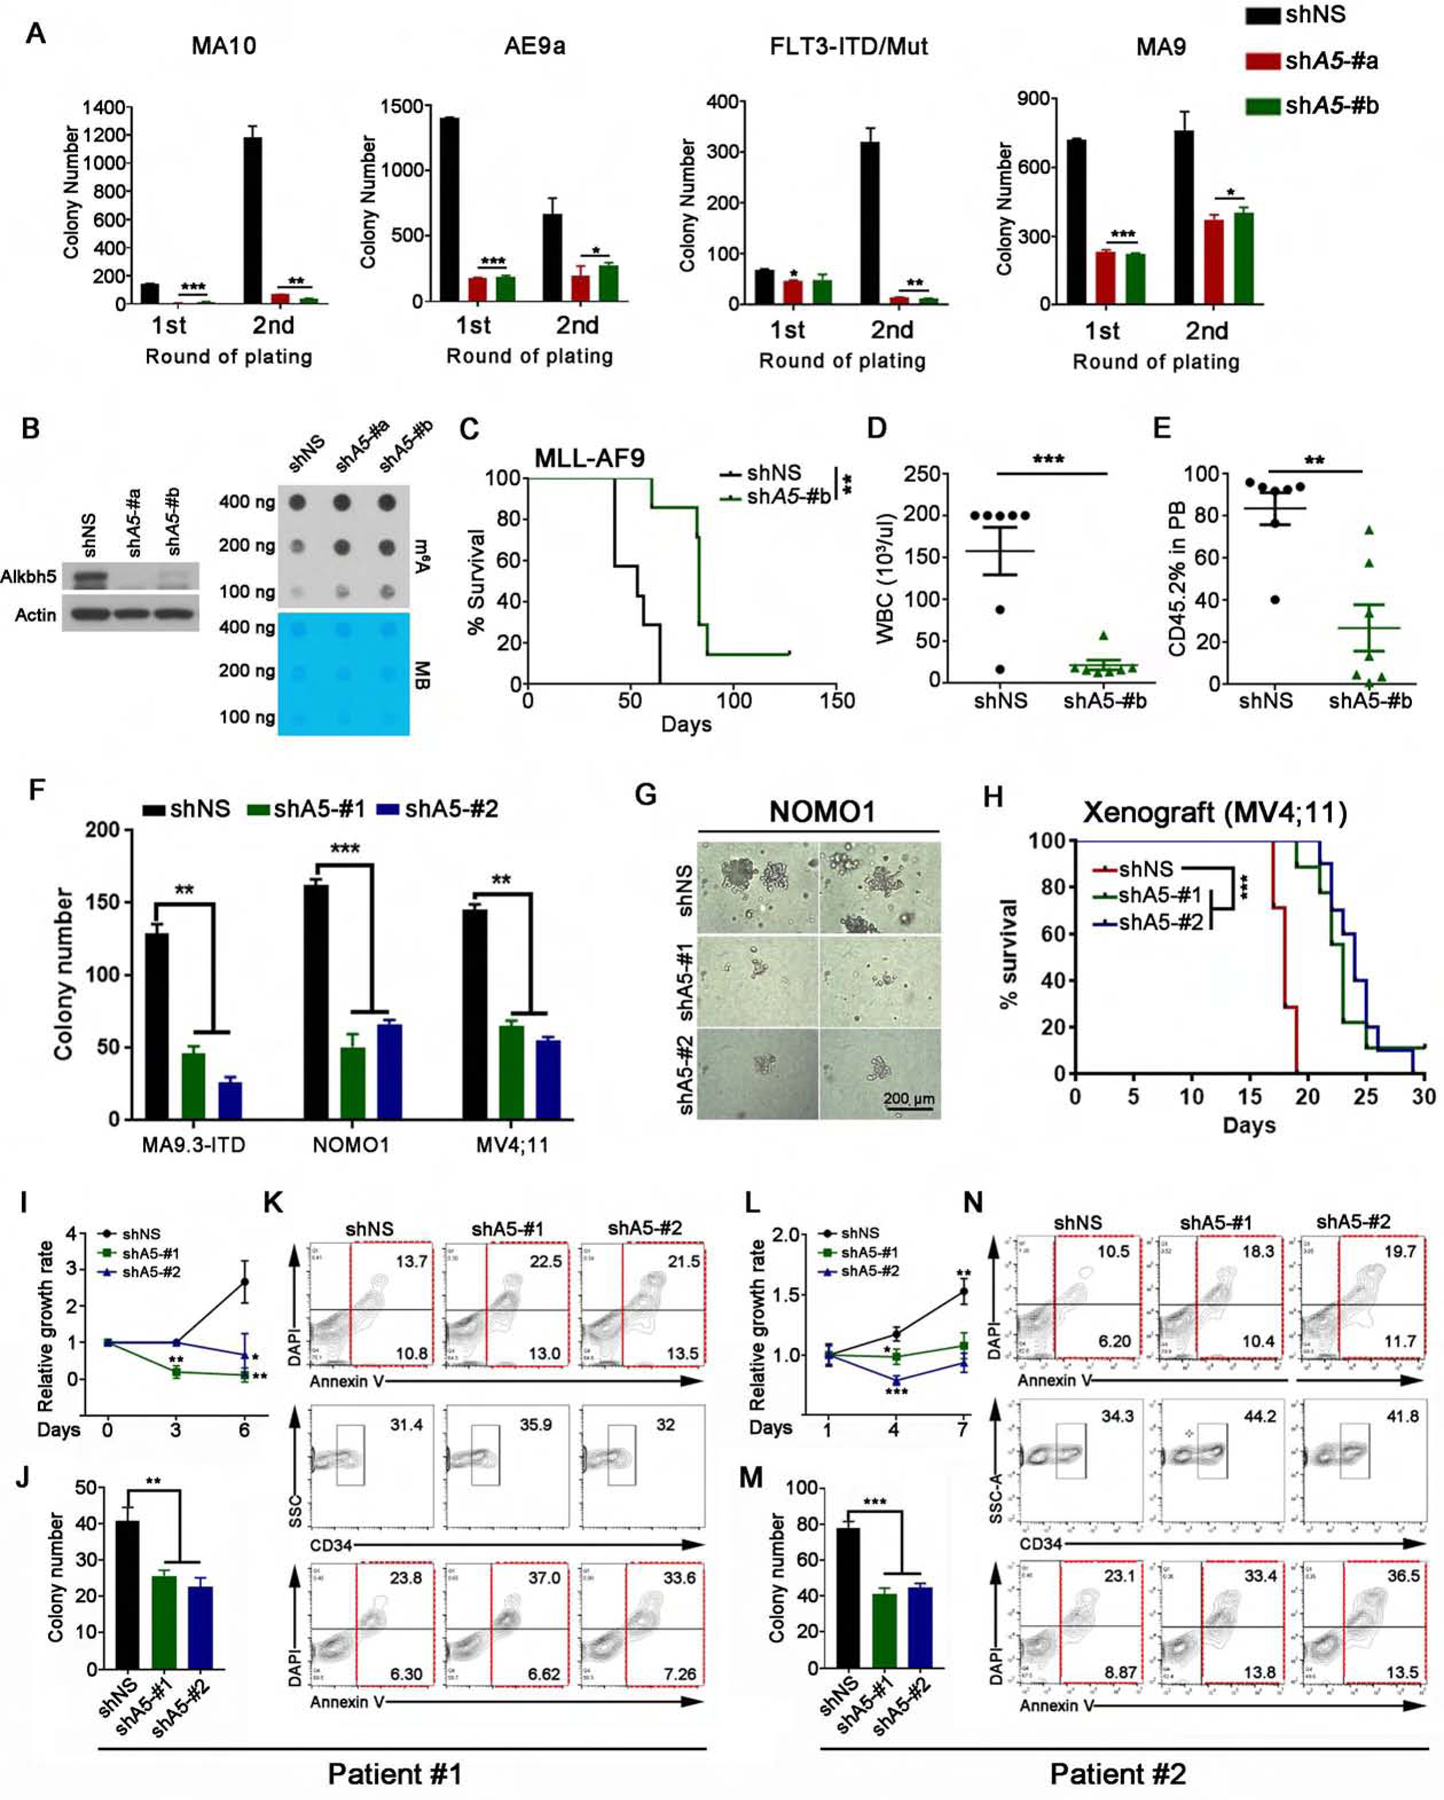
Figure 3. Knockdown of ALKBH5 affects the maintenance of human and murine AML.

(A) Primary mouse leukemic BM cells were transduced with lentiviruses expressing control shRNA (shNS) and two independent shRNAs targeting Alkbh5 (shA5-#a and shA5-#b) and serially replated. Colony forming cell counts at each round of plating were shown (n=3).
(B) Western blot of Alkbh5 (left) and dot blot of global m6A abundance (right) in mouse MA9 AML cells transduced with shNS or Alkbh5 shRNAs. Actin was used as a loading control in Western blot. MB, methylene blue staining, was used as loading control in m6A dot blot.
(C) Kaplan-Meier survival curves of recipients transplanted with mouse MA9 AML cells with shNS or Alkbh5 shRNA (shA5-#b) (n=7 for each group).
(D-E) WBC count (D) and percentage of CD45.2+ cells (E) in the PB of recipient mice.
(F and G) Human AML cells were transduced with shNS or ALKBH5 shRNAs and then plated for colony forming assays. (F) Colony forming cell counts (n=3). (G) Representative pictures of colonies from NOMO1 cells. MA9.3-ITD (P53 wild-type), NOMO1 (P53 mutant) and MV4;11 (P53 wild-type) were used.
(H) Kaplan-Meier survival curves of NSGS mice transplanted with MV4;11 AML cells that were transduced with shNS (n=7) or ALKBH5 shRNAs (shA5-#1, n=9; shA5-#2, n=10) (0.1×10⁶ donor cells/mouse).
(I-N) Primary leukemia cells from AML patients were transduced with shNS or ALKBH5 shRNAs and then seeded for experiments. (I, L) Cell growth/proliferation assays of transduced primary AML cells. (J, M) Colony forming cell counts of transduced AML cells. (K, N) Percentage of apoptotic cells in overall (top panel) or CD34+ (lower panel) transduced AML cells.
*p < 0.05; **p <0.01; ***p < 0.001; t test (for Figures 3A, D–F, I–J and L–M; Mean±SD values are shown) or log-rank test (for Figures 3C and H). See also Figure S3.
