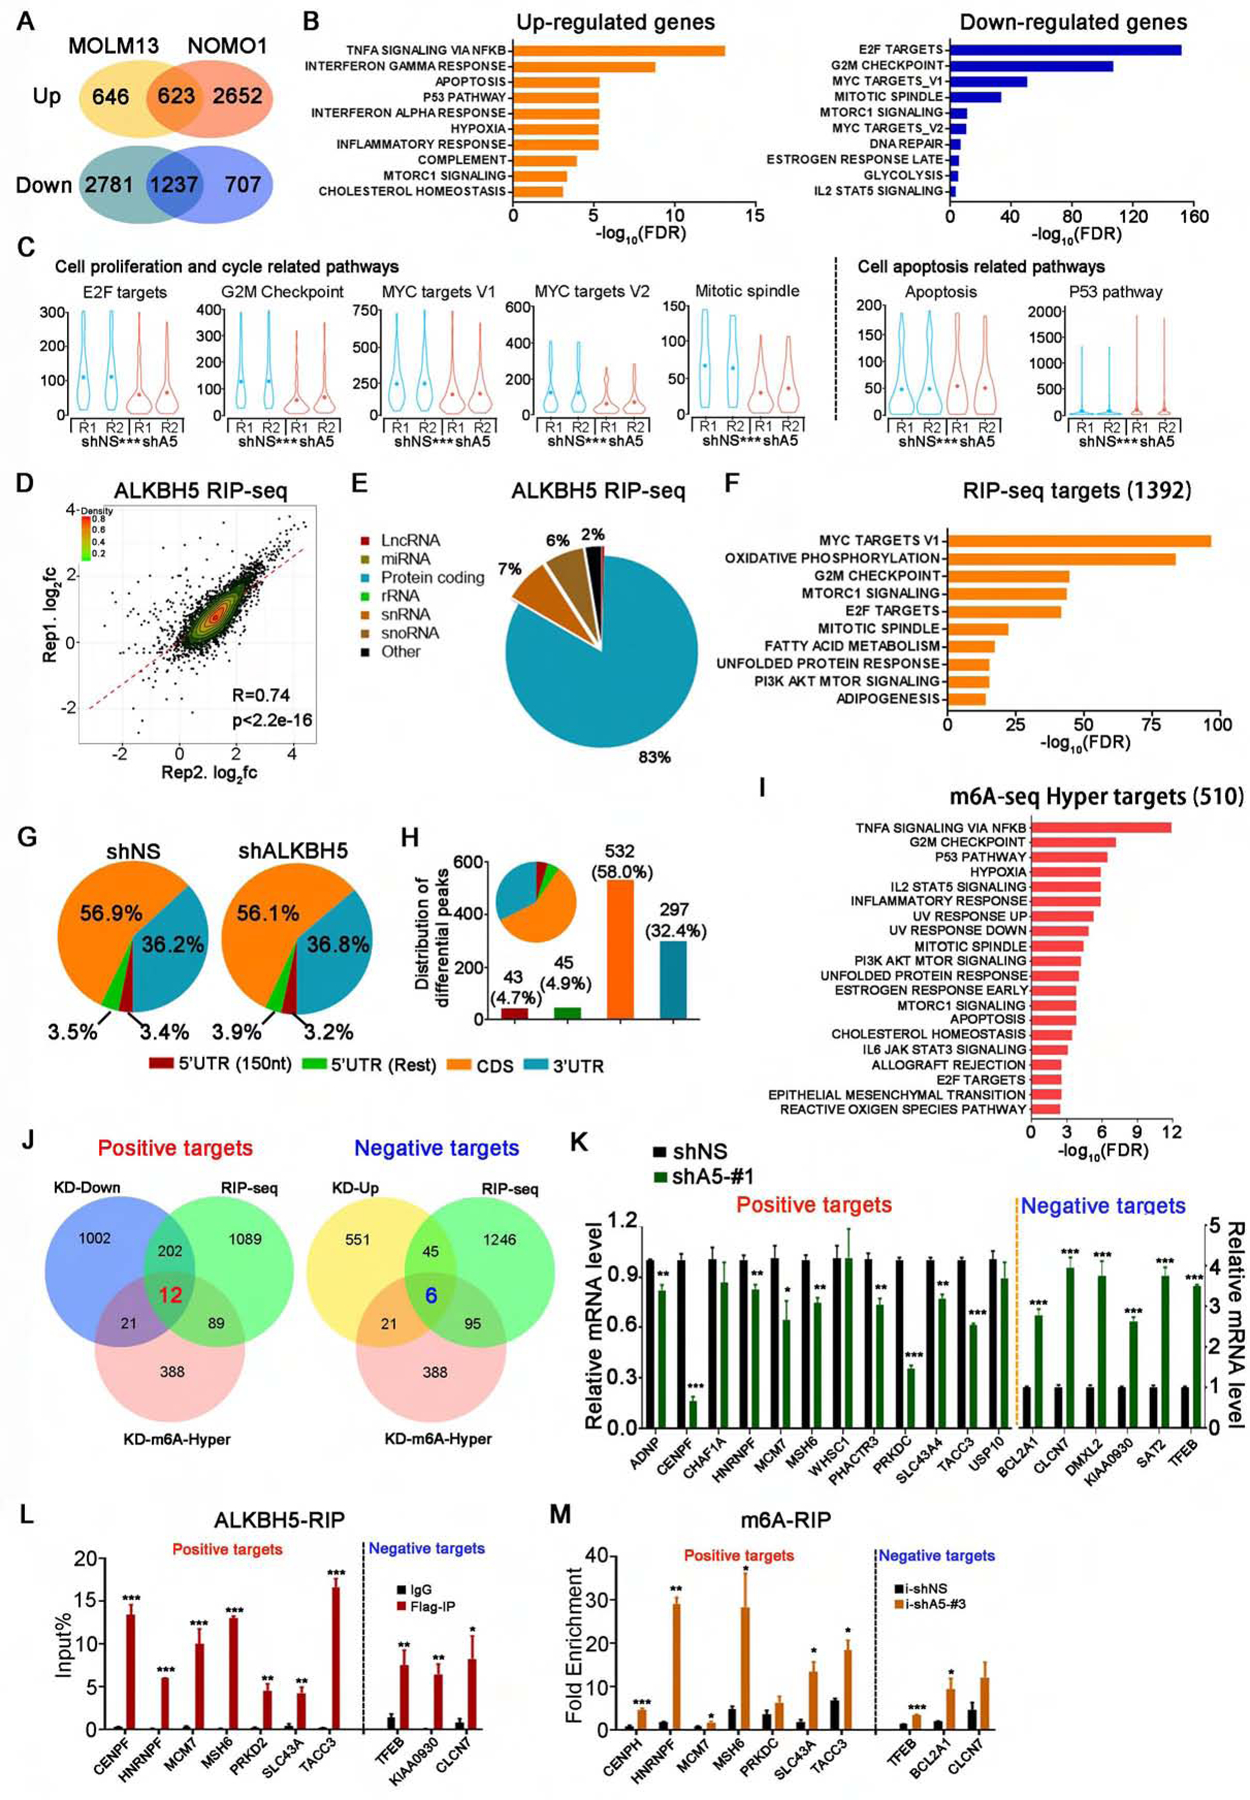
Figure 5. Transcriptome-wide identification of ALKBH5 potential targets in AML cells.

(A-C) RNA-seq analysis of gene expression profiles in ALKBH5 knockdown AML cells and control AML cells. (A) Venn diagram shows numbers of genes with significant changes in expression (RPKM>1, fold change>1.5) upon ALKBH5 knockdown. (B) GSEA of up- and down-regulated genes. (C) Violin plots showing the relative abundance of genes involved in the indicated pathways in ALKBH5 knockdown or control NOMO1 cells.
(D-F) RIP-seq analysis of ALKBH5 overexpressing NOMO1 cells. (D) Scatter plots of ALKBH5 RIP-seq replicates showing the correlation of enriched genes. (E) Pie charts showing the distribution of RIP-seq reads in RNA classes. (F) GSEA of significantly enriched genes in RIP samples (RPKM>1, immunoprecipitation/input>2).
(G-I) m6A-seq analysis of ALKBH5 knockdown NOMO1 cells. (G) The distribution of total m6A peaks in the indicated regions of mRNA transcripts in the control and ALKBH5-knockdown cells. (H) The distribution of differential m6A peaks (i.e., those with significant changes upon ALKBH5 manipulation). 5’UTR (150 nt) represents the first 150 nt of 5’ end of 5’UTR, while 5’UTR (Rest) represents the remaining regions of 5’UTR. (I) GSEA of the genes with significantly increased m6A abundance in ALKBH5 knockdown cells (p<0.05).
(J) Integrative analysis to identify transcriptome-wide potential targets of ALKBH5 in AML. Left: potential positive targets of ALKBH5. Right: potential negative targets of ALKBH5. KD-Down and KD-Up: genes with significantly decreased and increased expression, respectively, upon ALKBH5 knockdown in both NOMO1 and MOLM13 cells as detected by RNA-seq (RPKM>1, fold change >1.5). RIP-seq: genes with significant enrichment in RIP samples (RPKM>1, immunoprecipitation/input>2). KD-m6A-Hyper: genes with significantly higher m6A abundance in ALKBH5 knockdown cells (p<0.05).
(K) Expression change validation of potential positive and negative targets of ALKBH5 by qPCR.
(L) ALKBH5-RIP qPCR validation of ALKBH5 binding of representative positive and negative targets.
(M) Gene-specific m6A-RIP qPCR validation of m6A level changes of representative positive targets and negative targets.
Mean±SD values are shown for Figures 5C, K, L and M.*p < 0.05; **p <0.01; ***p < 0.001; t test. See also Figure S5.
