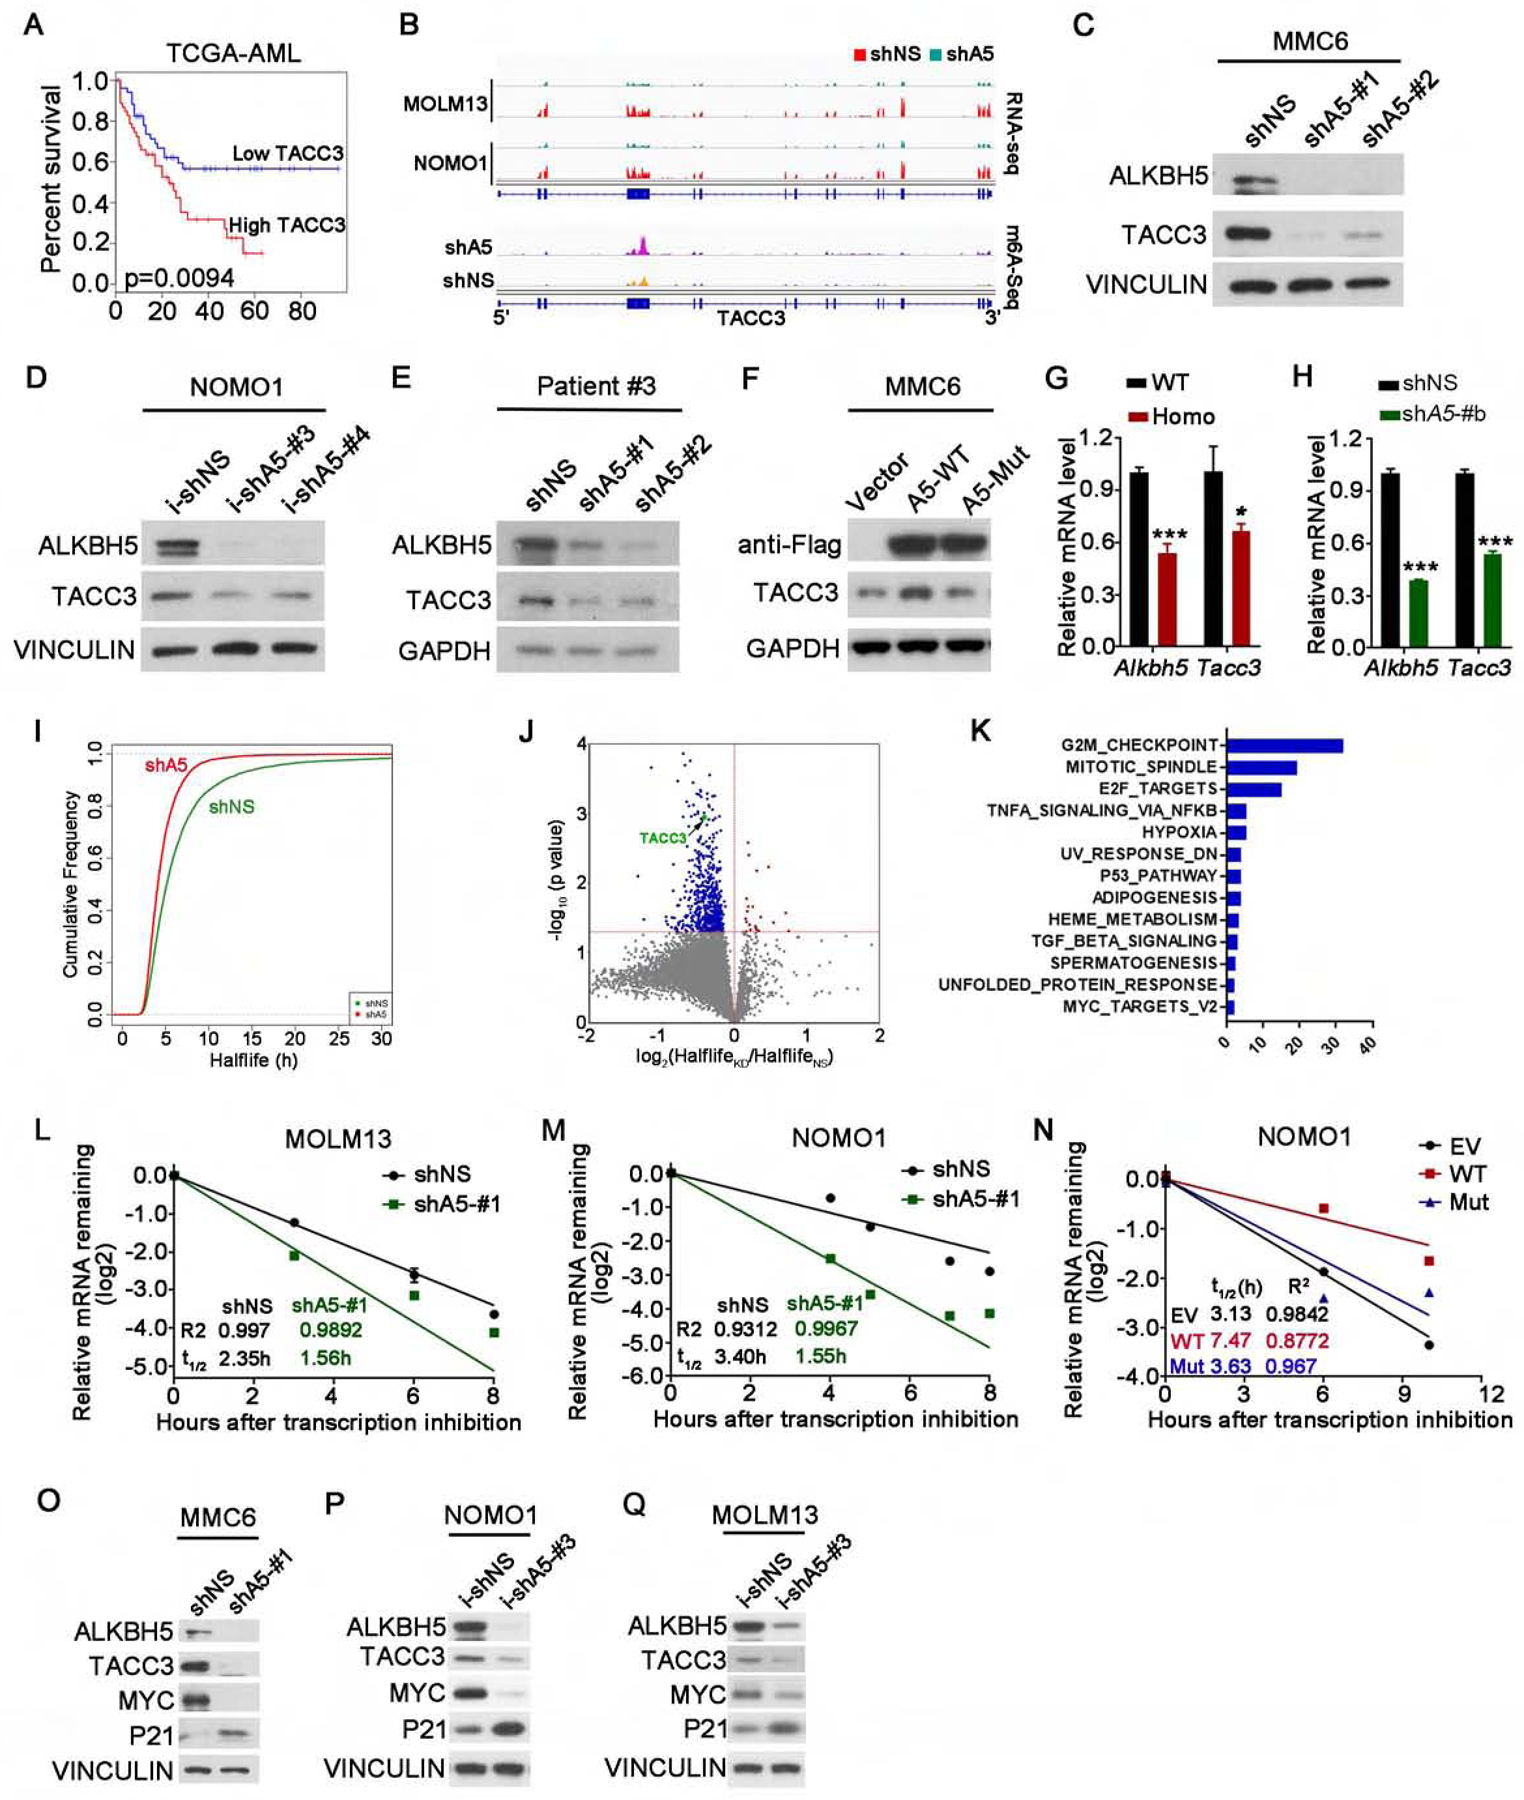
Figure 6. ALKBH5 regulates TACC3 expression via affecting its mRNA stability.

(A) Kaplan-Meier survival analysis of TACC3 in the TCGA AML dataset. The p value was detected by the log-rank test.
(B) The RNA (top) and m6A (bottom) abundance in TACC3 mRNA transcripts in ALKBH5 knockdown and control AML cells as detected by RNA-seq and m6A-seq.
(C-E) Western blots of ALKBH5 and TACC3 in ALKBH5 stable knockdown MMC6 cells (C), ALKBH5 inducible knockdown NOMO1 cells (Dox induction for 4 days) (D) and ALKBH5 stable knockdown primary AML cells (E). VINCULIN or GAPDH was used as a loading control.
(F) Western blots of ALKBH5 and TACC3 in MMC6 cells transduced with lentiviruses expressing empty vector (Vector) or wild-type ALKBH5 protein (A5-WT) or m6A demethylase-inactive mutant (A5-Mut). GAPDH was used as a loading control.
(G-H) qPCR detection of Tacc3 expression in Alkbh5 WT or Homo KO mouse BM cells (G) and in primary mouse MA9 AML cells with shNS or Alkbh5 shRNA (shA5-#b) (H).
(I-K) mRNA stability profiling. (I) Cumulative distribution of global transcript stability changes in shNS or shA5-#1 transduced NOMO1 cells. (J) Distribution of genes with significant half-life change in ALKBH5 knockdown cells compared to control cells. (K) Pathway analysis by GSEA showing the major pathways in which the genes with significantly shortened half-lives upon ALKBH5 knockdown are enriched.
(L-N) The mRNA half-life (t1/2) of TACC3 in MOLM13 cells (L) and NOMO1 cells (M) transduced with shNS or ALKBH5 shRNA (shA5-#1), and in NOMO1 cells transduced with empty vector (EV) or wild-type ALKBH5 (A5-WT) or ALKBH5 mutant (A5-Mut) (N).
(O-Q) Western blots of ALKBH5, TACC3, MYC and P21 in AML cells transduced with shNS or shALKBH5 (shA5-#1) (O) or with inducible shNS (i-shNS) or shALKBH5 (i-shA5-#3) (P and Q). VINCULIN was used as a loading control.
Mean±SD values are shown for Figures 6G–H and L–N. *p < 0.05; ***p<0.001, t test. See also Figure S6.
