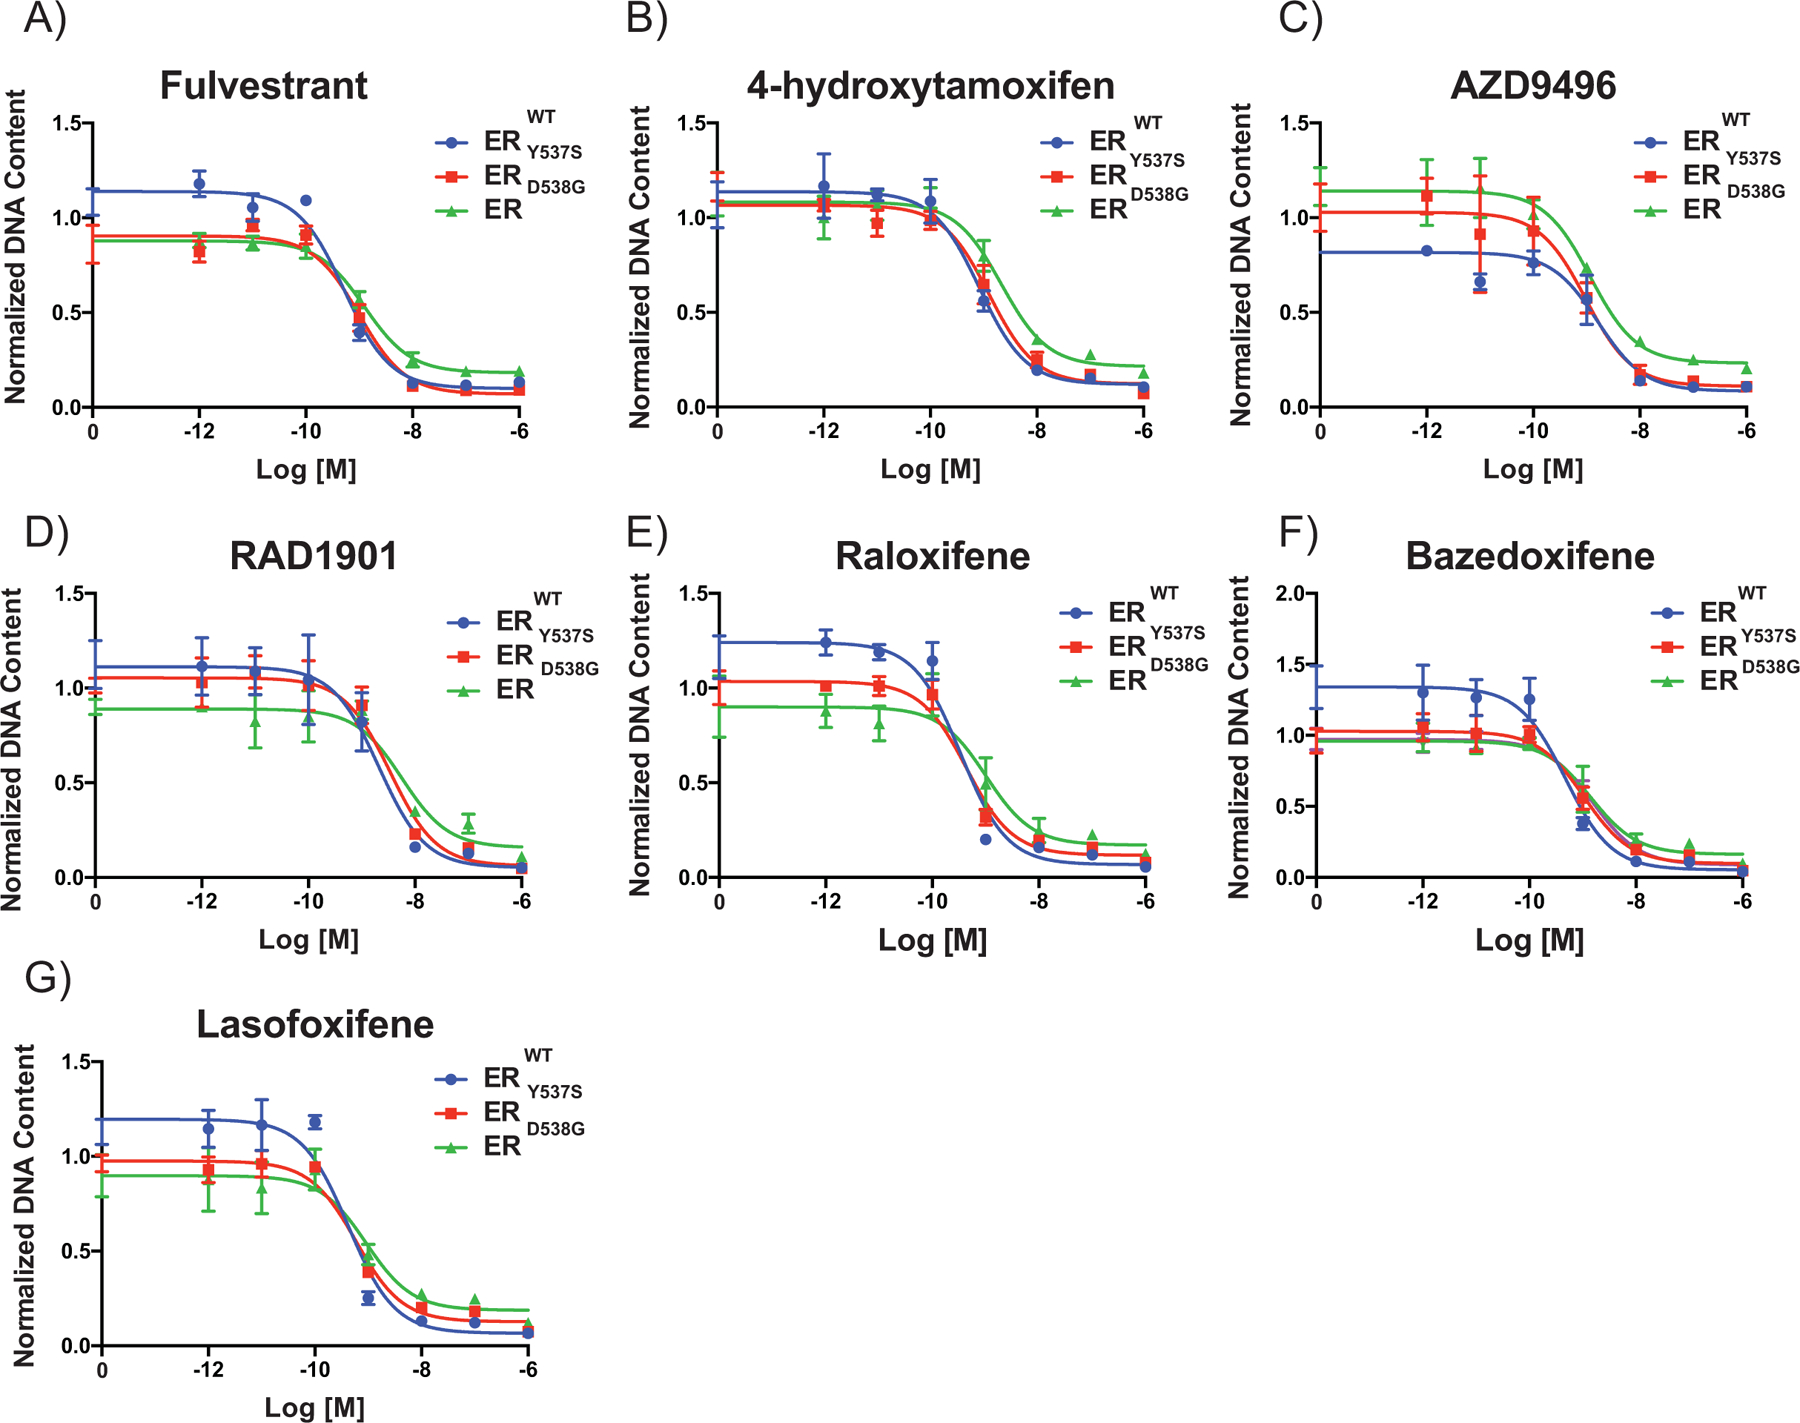
Figure 1: Cells expressing both the ERWT and ERmuts have similar pharmacological responses to antiestrogens when compared to cells only expressing ERWT.

(A-G) MCF7B cells were grown in DMEM-F12 media containing 2% FBS for 7 days while being treated with ER antagonists (10−12-10−6 M). Cellular proliferation was assessed by measuring DNA content (Hoechst stain) and DNA content is normalized to vehicle. Data points are the mean of three technical replicates, and error bars are the standard deviation of these replicates. Data presented is a representative of three independent experiments. Two-way ANOVA was utilized, comparing the logIC50 of all three independent experiments, to determine if there were significant differences between the WT and mutant receptors. No significant differences (p-value < 0.05) were determined.
